- Home >
- Stock Photos >
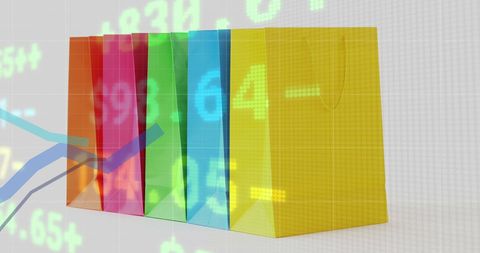
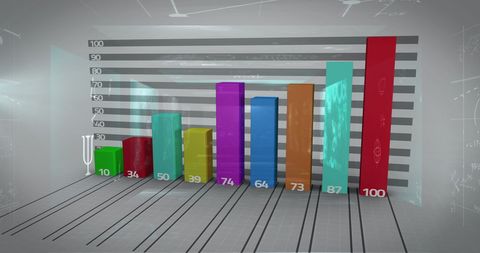
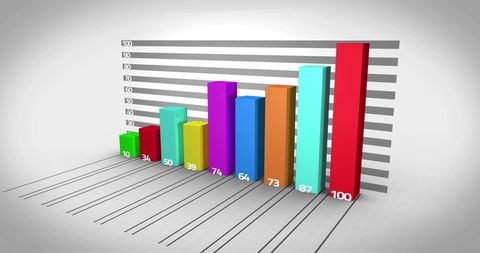
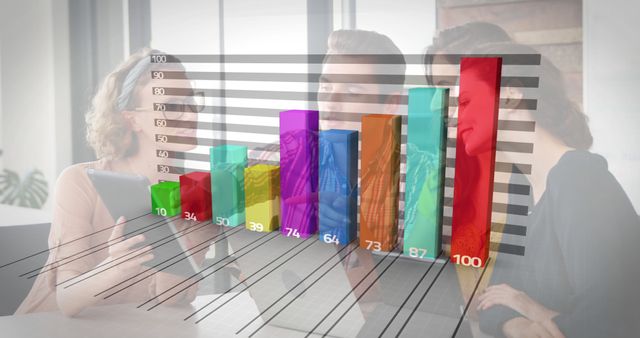
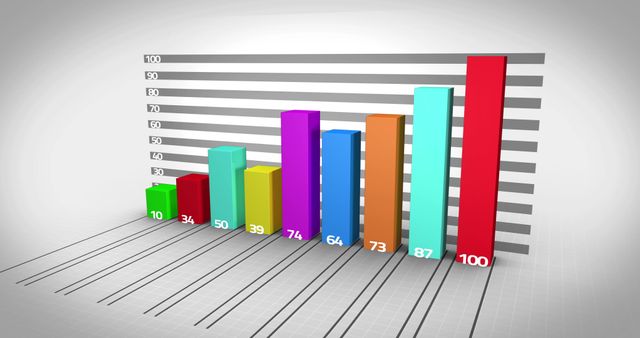
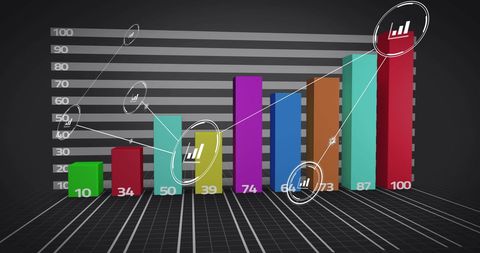
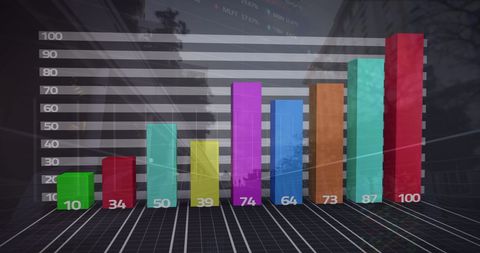
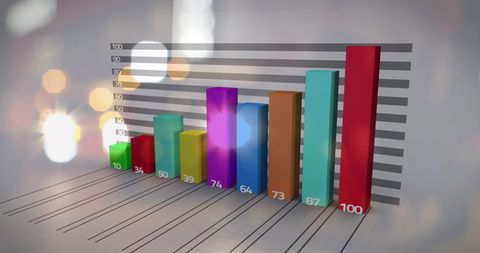
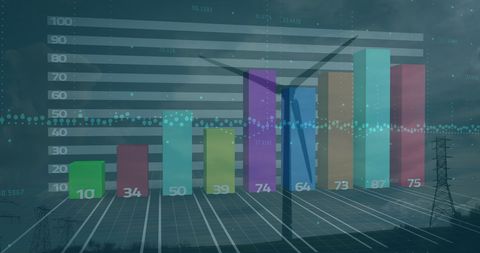
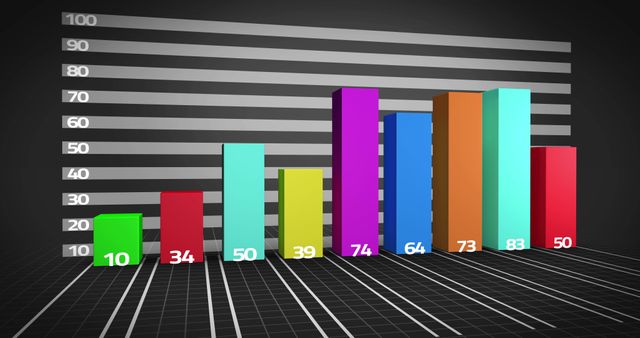
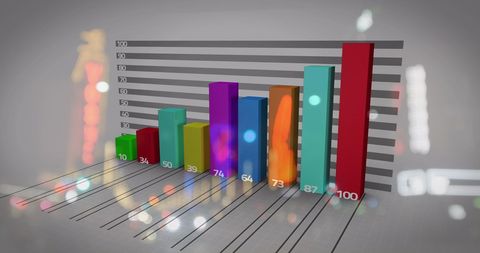
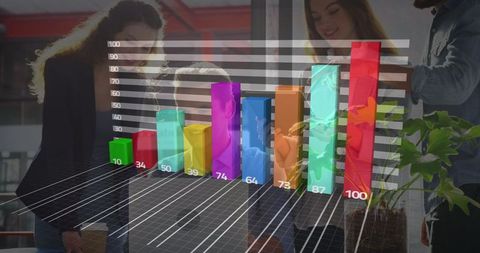
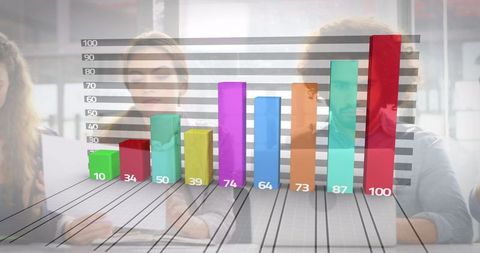
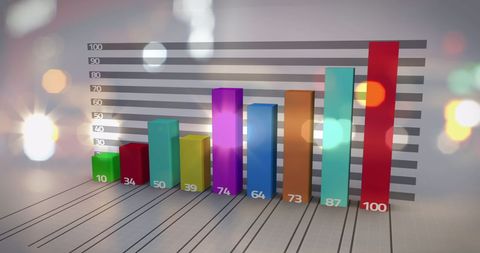
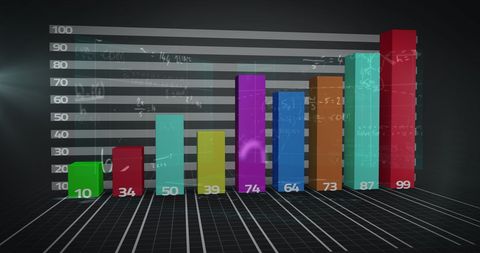
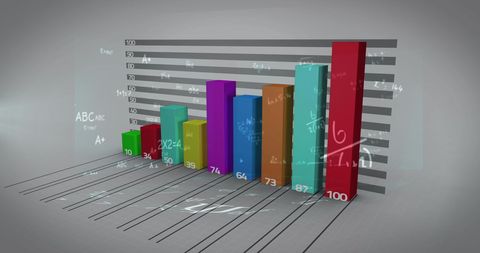
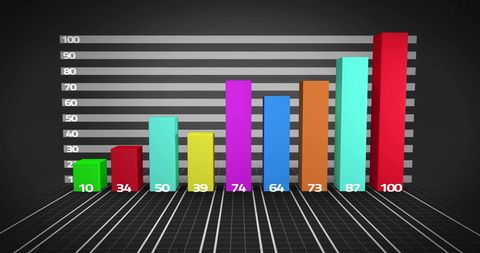
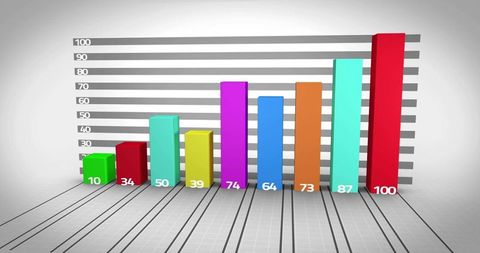
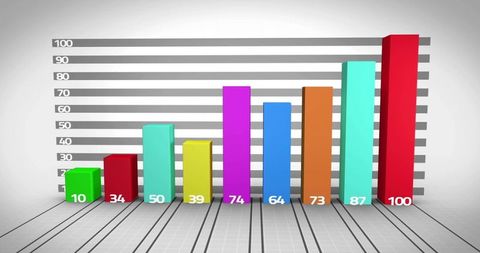
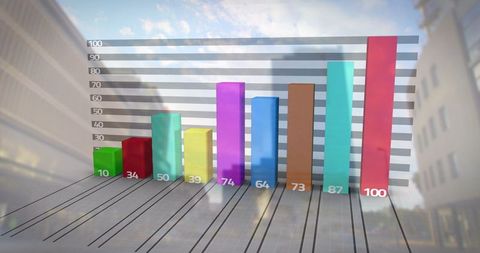
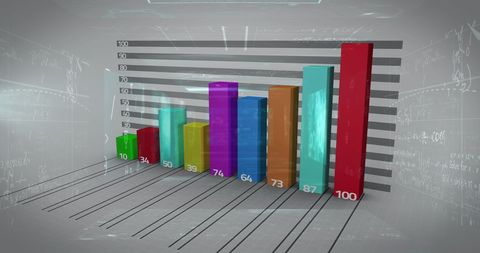
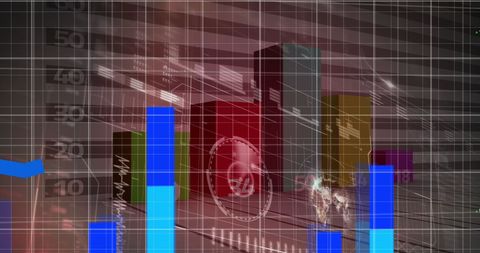
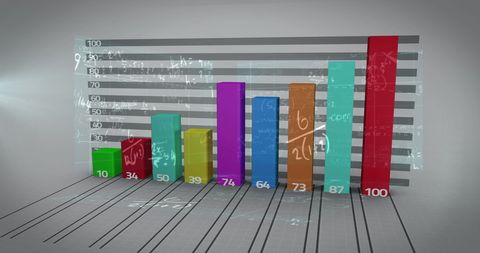
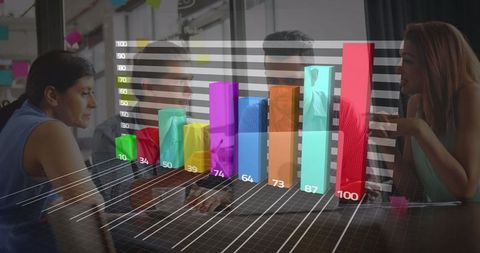
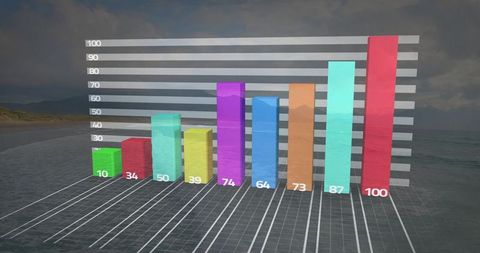
- Colorful 3D Bar Graph with Mathematical Formulas Overlay
Colorful 3D Bar Graph with Mathematical Formulas Overlay Image
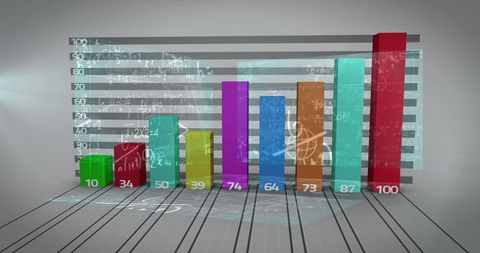
Complex 3D bar chart overlaid with equations represents intersection of mathematics and financial analysis. Useful for financial presentations, data visualization topics, educational materials highlighting math applications.
Powered by 


2
downloads
downloads
Tags:
More
Credit Photo
If you would like to credit the Photo, here are some ways you can do so
Text Link
photo Link
<span class="text-link">
<span>
<a target="_blank" href=https://pikwizard.com/photo/colorful-3d-bar-graph-with-mathematical-formulas-overlay/296f9c0c62fad33451aa4d1f9f197afb/>PikWizard</a>
</span>
</span>
<span class="image-link">
<span
style="margin: 0 0 20px 0; display: inline-block; vertical-align: middle; width: 100%;"
>
<a
target="_blank"
href="https://pikwizard.com/photo/colorful-3d-bar-graph-with-mathematical-formulas-overlay/296f9c0c62fad33451aa4d1f9f197afb/"
style="text-decoration: none; font-size: 10px; margin: 0;"
>
<img src="https://pikwizard.com/pw/medium/296f9c0c62fad33451aa4d1f9f197afb.jpg" style="margin: 0; width: 100%;" alt="" />
<p style="font-size: 12px; margin: 0;">PikWizard</p>
</a>
</span>
</span>
Free (free of charge)
Free for personal and commercial use.
Author: Creative Art