- Home >
- Stock Photos >
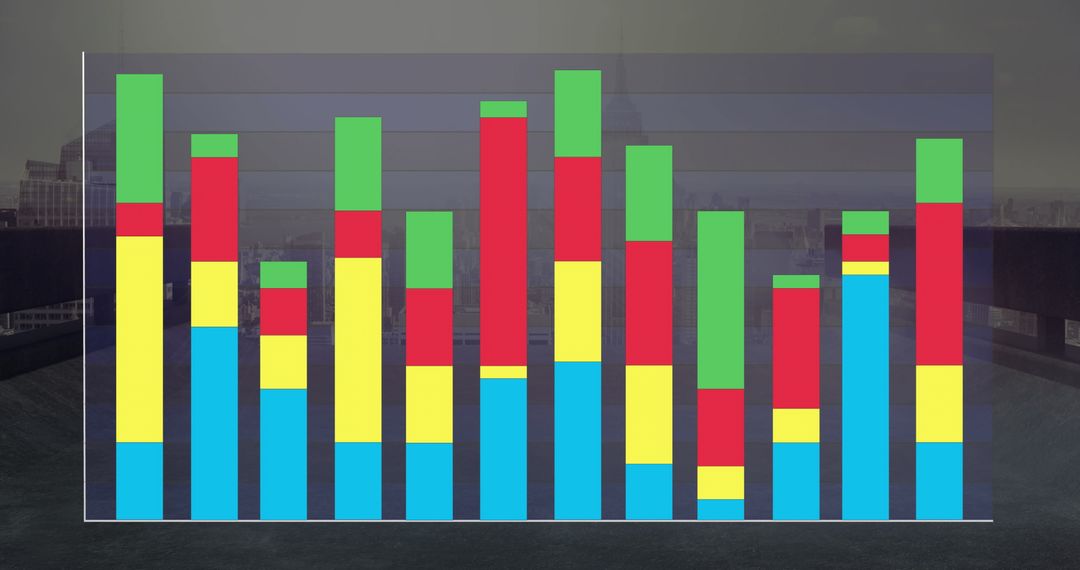
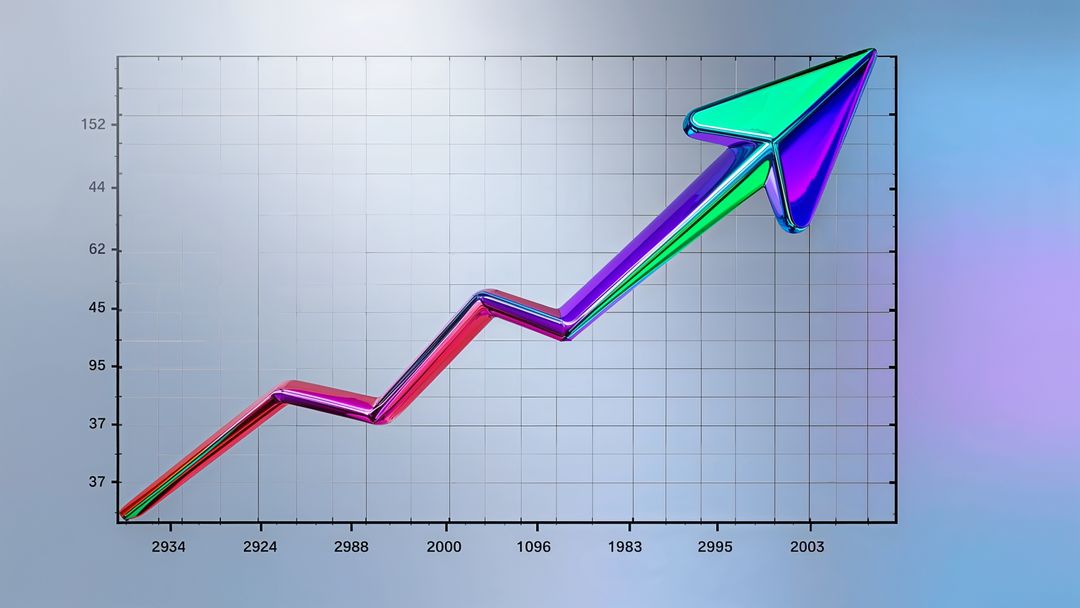
- Colorful 3D Data Visualization with Arrows and Charts
Colorful 3D Data Visualization with Arrows and Charts Image

AI Generated Image. Image creatively depicts 3D data visualization using bar charts and arrows indicating growth on a light background. Elements like ribbon loops and stacked coins enhance modern business context. Suitable for presentations on data analysis, financial growth, technology trends, and digital marketing.
Powered by  - Get 15% off with code: PIKWIZARD15


2
downloads
downloads
Tags:
More
Credit Photo
If you would like to credit the Photo, here are some ways you can do so
Text Link
photo Link
<span class="text-link">
<span>
<a target="_blank" href=https://pikwizard.com/photo/colorful-3d-data-visualization-with-arrows-and-charts/5c5e8f209b5dbffe3c503582946f7687/>PikWizard</a>
</span>
</span>
<span class="image-link">
<span
style="margin: 0 0 20px 0; display: inline-block; vertical-align: middle; width: 100%;"
>
<a
target="_blank"
href="https://pikwizard.com/photo/colorful-3d-data-visualization-with-arrows-and-charts/5c5e8f209b5dbffe3c503582946f7687/"
style="text-decoration: none; font-size: 10px; margin: 0;"
>
<img src="https://pikwizard.com/pw/medium/5c5e8f209b5dbffe3c503582946f7687.jpg" style="margin: 0; width: 100%;" alt="" />
<p style="font-size: 12px; margin: 0;">PikWizard</p>
</a>
</span>
</span>
Free (free of charge)
Free for personal and commercial use.
Author: AI Creator
Similar Free Stock Images

Premium


Premium


Premium


Premium


Premium


Premium


Premium


Premium


Premium


Premium


Premium


Premium


Premium