
- Home >
- Stock Photos >
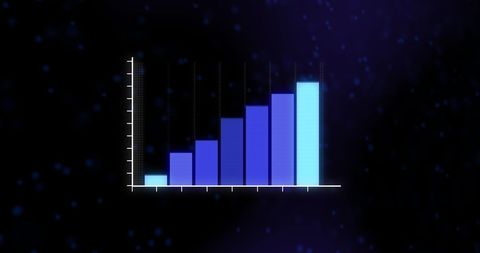
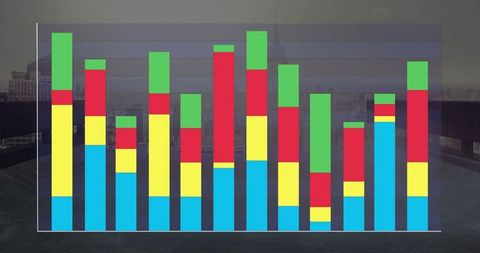
- Colorful 3D Graph Analytics on Digital Screen Interface
Colorful 3D Graph Analytics on Digital Screen Interface Image
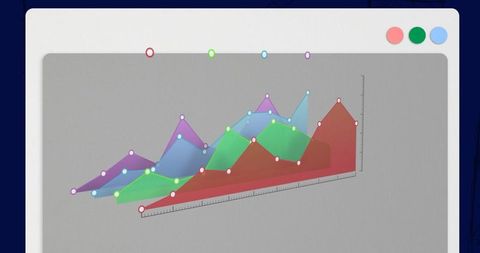
Colorful 3D graph visualizations displayed on a digital screen, depicting data analytics and trends. Ideal for showcasing technological advancements, data interpretation tools, and modern business solutions on websites or presentations dedicated to digital technology funnels. Useful for presentations on project management, software development, or education slides to highlight concepts of growth and statistics.
Powered by 


downloads
Tags:
More
Credit Photo
If you would like to credit the Photo, here are some ways you can do so
Text Link
photo Link
<span class="text-link">
<span>
<a target="_blank" href=https://pikwizard.com/photo/colorful-3d-graph-analytics-on-digital-screen-interface/24f434fa8b3512c77e586aa9ef27edfa/>PikWizard</a>
</span>
</span>
<span class="image-link">
<span
style="margin: 0 0 20px 0; display: inline-block; vertical-align: middle; width: 100%;"
>
<a
target="_blank"
href="https://pikwizard.com/photo/colorful-3d-graph-analytics-on-digital-screen-interface/24f434fa8b3512c77e586aa9ef27edfa/"
style="text-decoration: none; font-size: 10px; margin: 0;"
>
<img src="https://pikwizard.com/pw/medium/24f434fa8b3512c77e586aa9ef27edfa.jpg" style="margin: 0; width: 100%;" alt="" />
<p style="font-size: 12px; margin: 0;">PikWizard</p>
</a>
</span>
</span>
Free (free of charge)
Free for personal and commercial use.
Author: Awesome Content
Similar Free Stock Images

Premium


Premium


AI


Premium

Premium


Premium

Premium


Premium


Premium


Premium


Premium


Premium


AI


Premium


Premium


Premium


Premium


Premium


Premium


Premium


Premium


AI


Premium


Premium

Premium


Premium


Premium


Premium


Explore More Free Stock Images