- Home >
- Stock Photos >
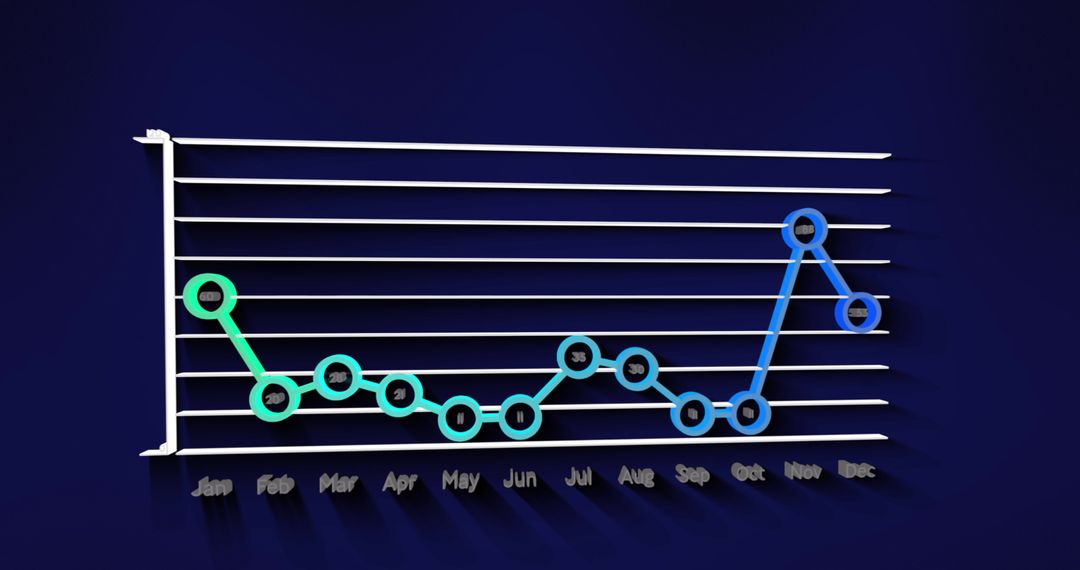
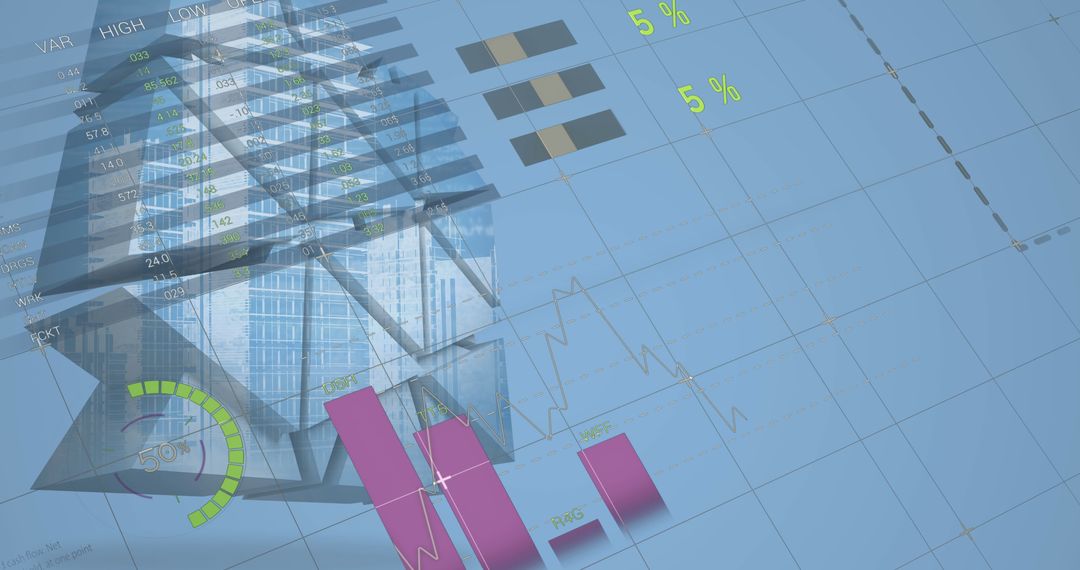
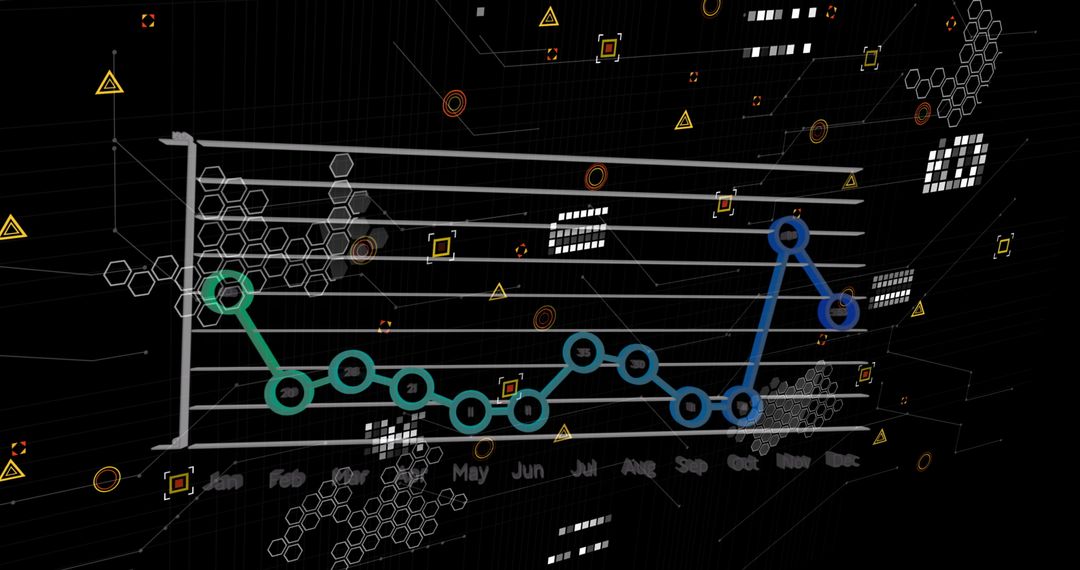
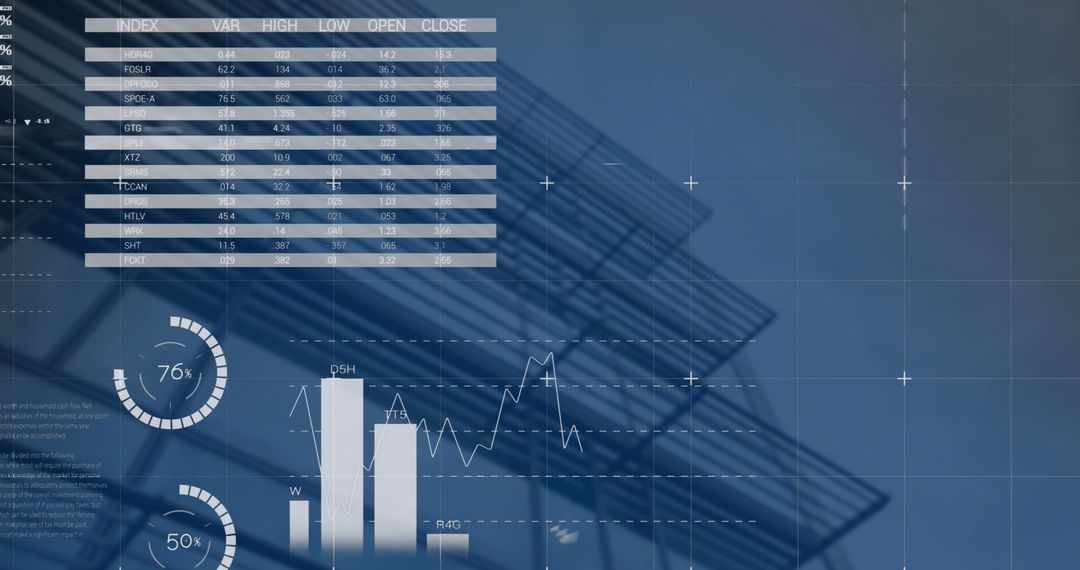
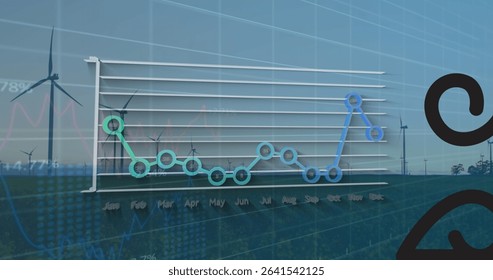
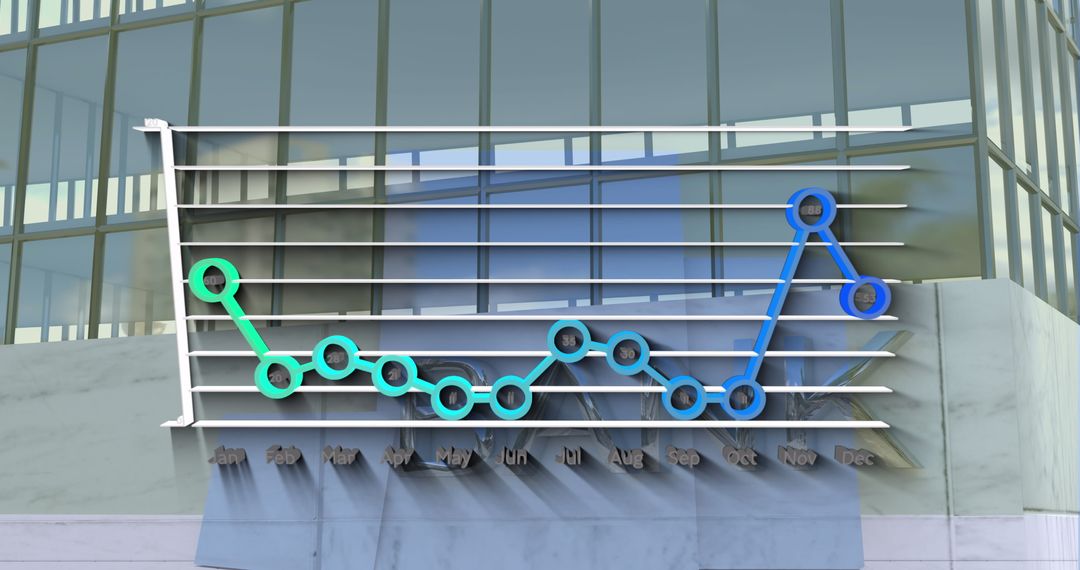
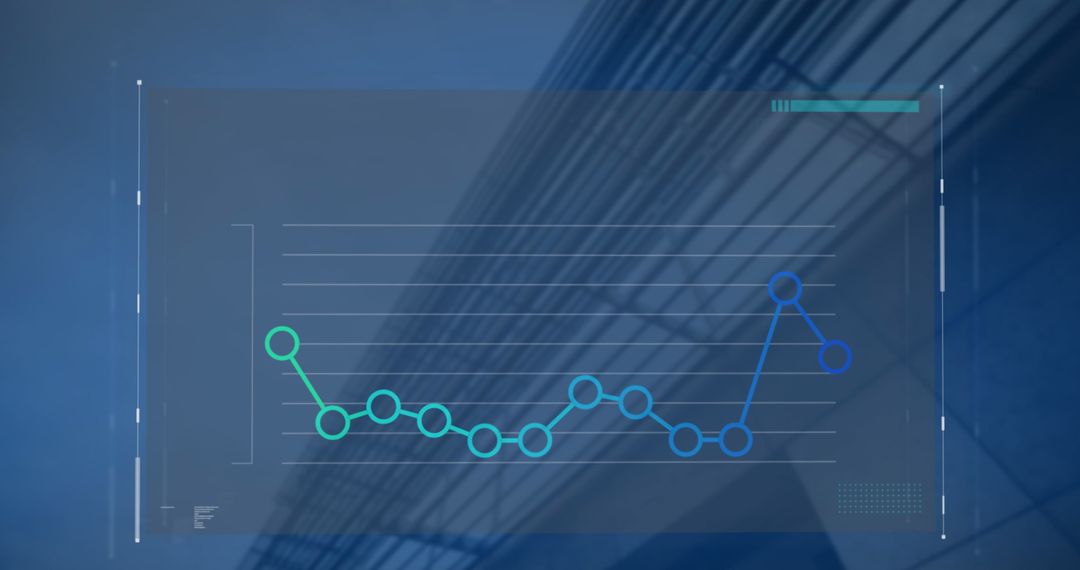
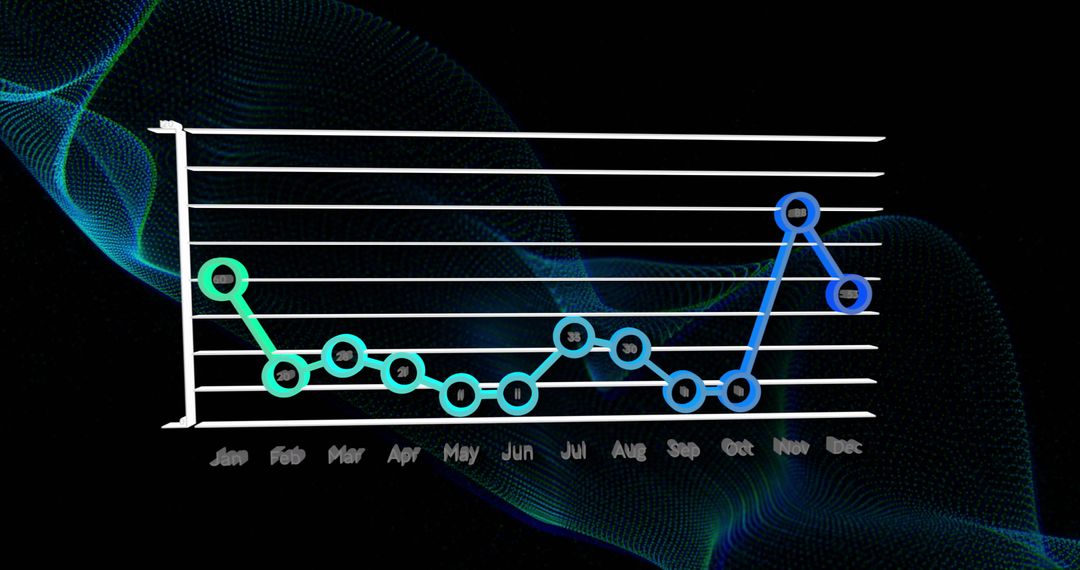
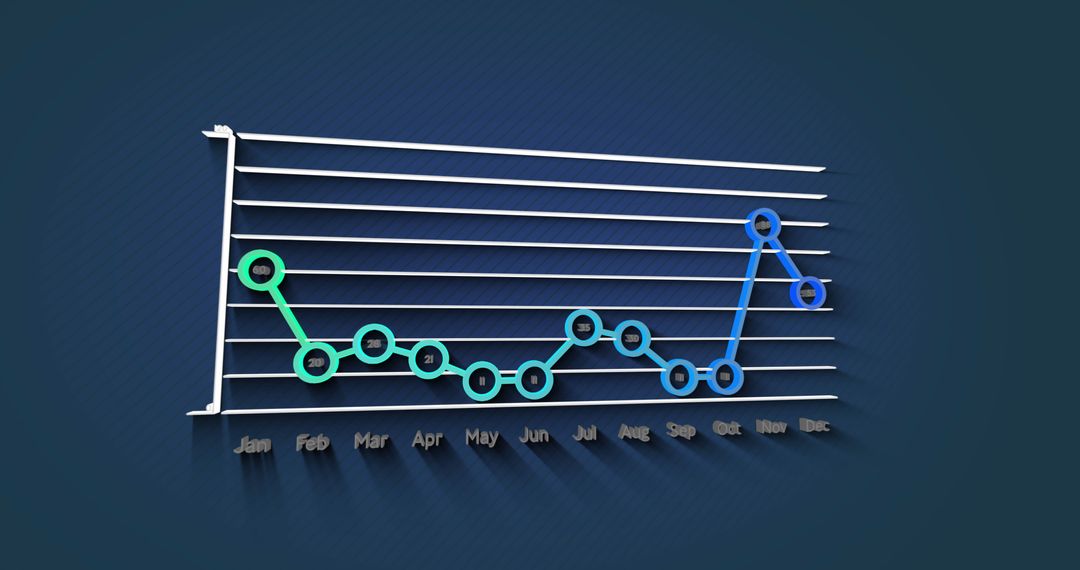
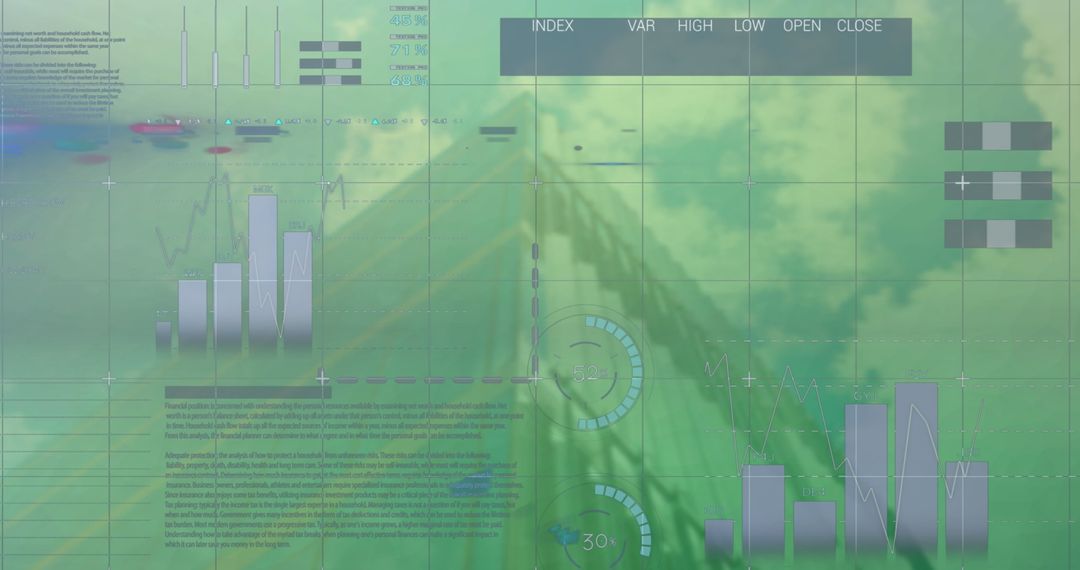
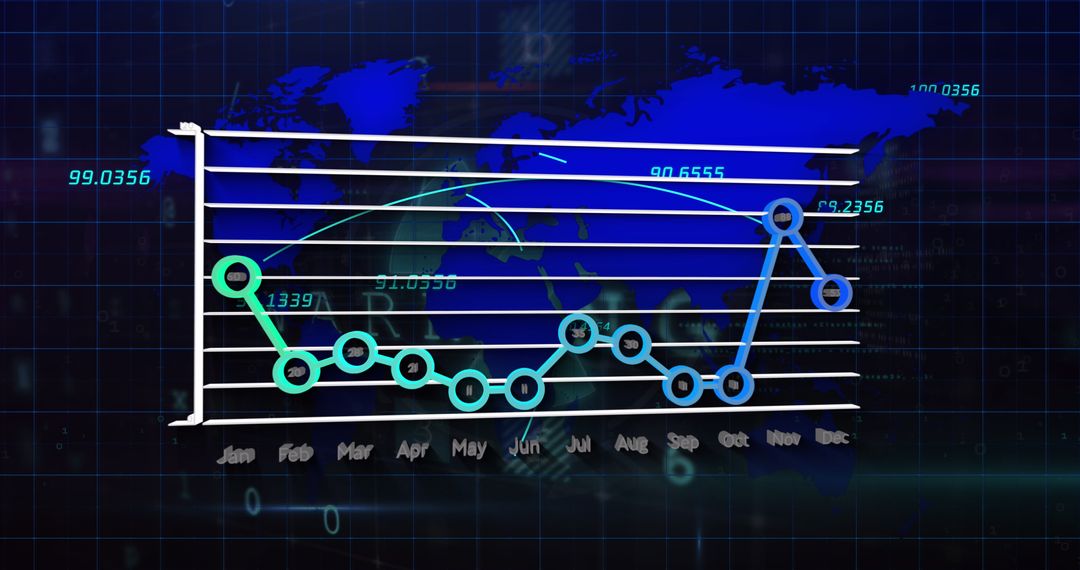
- Colorful 3D Graph with Monthly Data Trends in Futuristic Abstract Design
Colorful 3D Graph with Monthly Data Trends in Futuristic Abstract Design Image

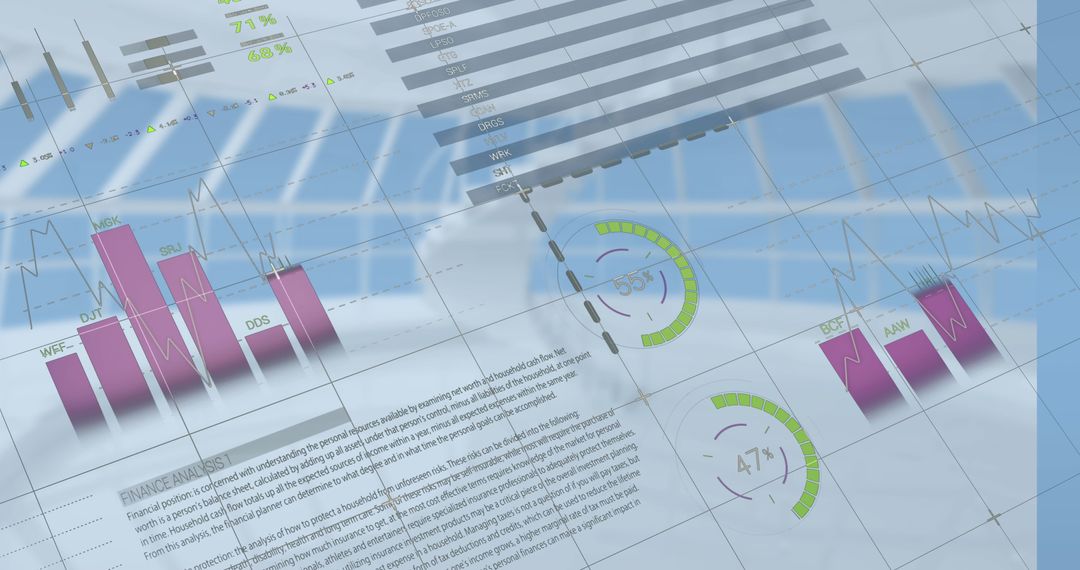
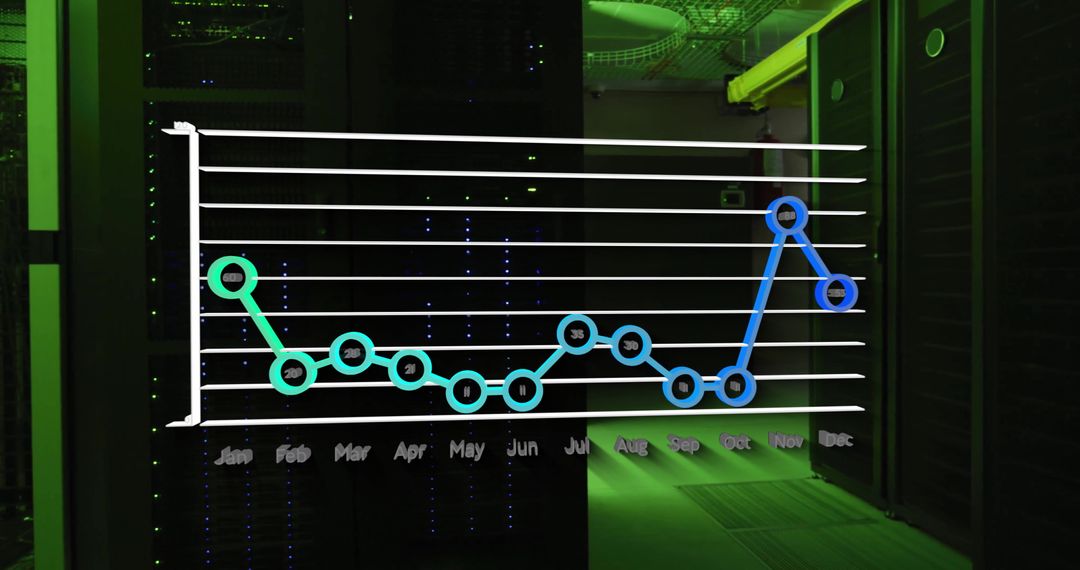
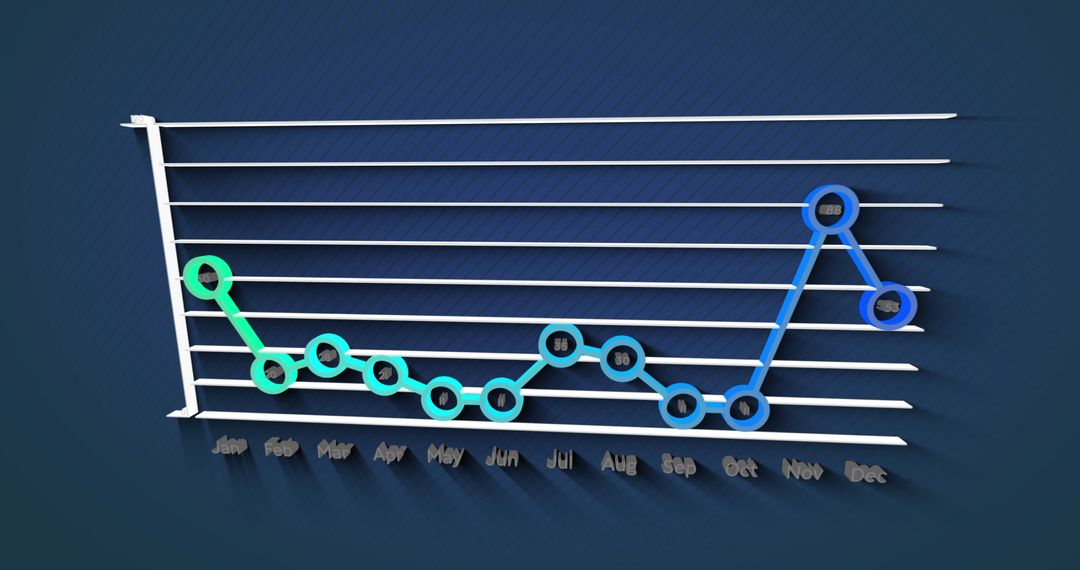
This visual presents a 3D graph showcasing monthly data trends set against abstract background elements. Ideal for use in presentations or reports focused on data analytics, business growth tracking, and futuristic design concepts in digital technology. The vibrant and digital theme suits technology companies, finance sectors, and educational materials focused on data visualization.
Powered by  - Get 15% off with code: PIKWIZARD15


2
downloads
downloads
Tags:
More
Credit Photo
If you would like to credit the Photo, here are some ways you can do so
Text Link
photo Link
<span class="text-link">
<span>
<a target="_blank" href=https://pikwizard.com/photo/colorful-3d-graph-with-monthly-data-trends-in-futuristic-abstract-design/9c27b604e81f46d49ae91c8cce7775a0/>PikWizard</a>
</span>
</span>
<span class="image-link">
<span
style="margin: 0 0 20px 0; display: inline-block; vertical-align: middle; width: 100%;"
>
<a
target="_blank"
href="https://pikwizard.com/photo/colorful-3d-graph-with-monthly-data-trends-in-futuristic-abstract-design/9c27b604e81f46d49ae91c8cce7775a0/"
style="text-decoration: none; font-size: 10px; margin: 0;"
>
<img src="https://pikwizard.com/pw/medium/9c27b604e81f46d49ae91c8cce7775a0.jpg" style="margin: 0; width: 100%;" alt="" />
<p style="font-size: 12px; margin: 0;">PikWizard</p>
</a>
</span>
</span>
Free (free of charge)
Free for personal and commercial use.
Author: Authentic Images
Similar Free Stock Images

Premium


Premium


Premium