
- Home >
- Stock Photos >
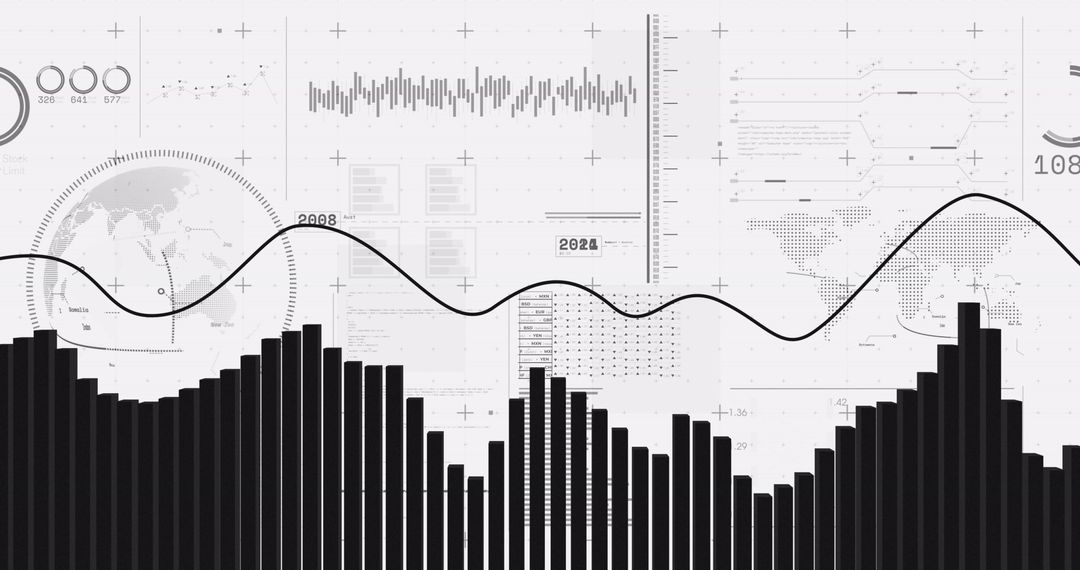
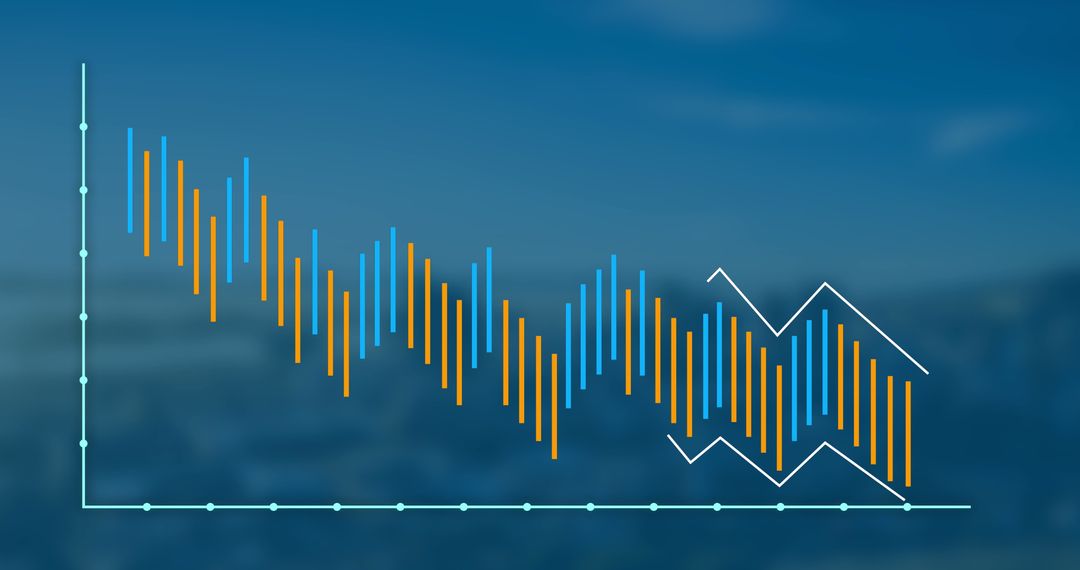
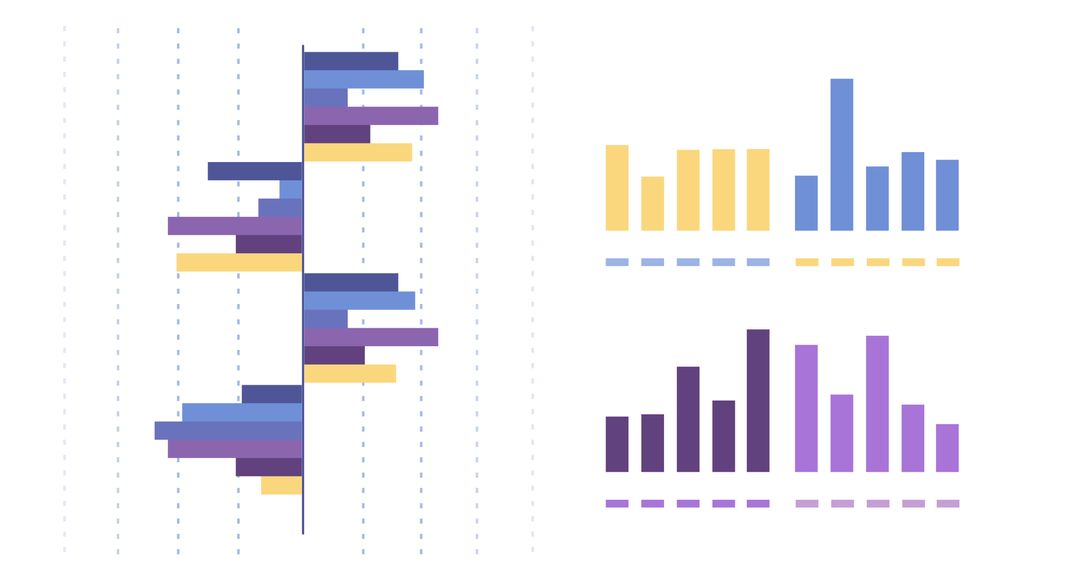
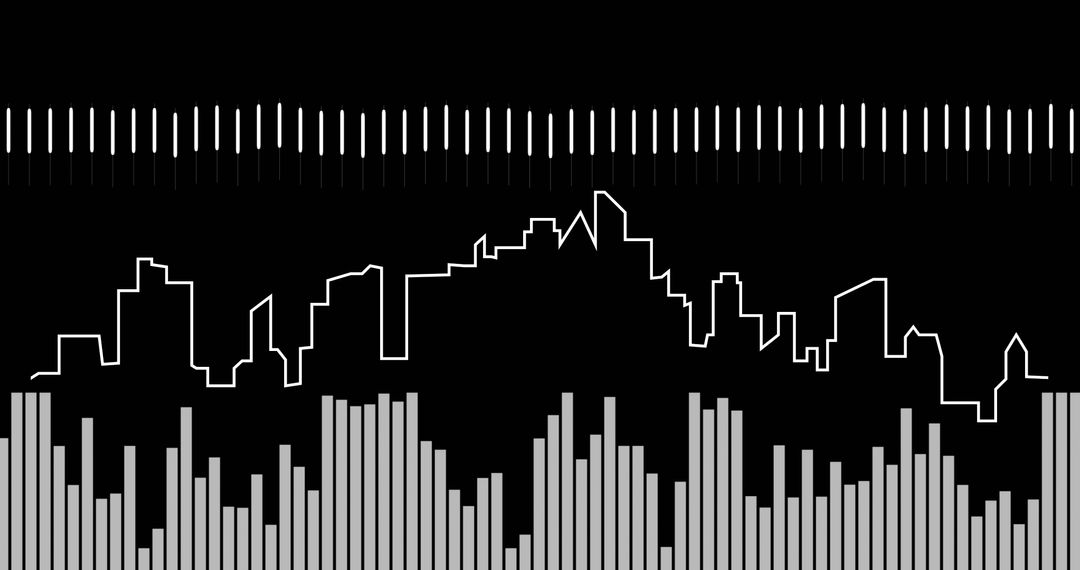
- Colorful Abstract Bar Chart Representing Statistical Data
Colorful Abstract Bar Chart Representing Statistical Data Image

This visualization showcases an abstract, colorful bar chart representing statistical or financial data. Ideal for presentations on data analysis, business reports, economic growth, and market research. Suitable for illustrating concepts in finance and digital tech environments.
Powered by  - Get 15% off with code: PIKWIZARD15


2
downloads
downloads
Tags:
More
Credit Photo
If you would like to credit the Photo, here are some ways you can do so
Text Link
photo Link
<span class="text-link">
<span>
<a target="_blank" href=https://pikwizard.com/photo/colorful-abstract-bar-chart-representing-statistical-data/119b21b6ef26e5e228014d39ed998eee/>PikWizard</a>
</span>
</span>
<span class="image-link">
<span
style="margin: 0 0 20px 0; display: inline-block; vertical-align: middle; width: 100%;"
>
<a
target="_blank"
href="https://pikwizard.com/photo/colorful-abstract-bar-chart-representing-statistical-data/119b21b6ef26e5e228014d39ed998eee/"
style="text-decoration: none; font-size: 10px; margin: 0;"
>
<img src="https://pikwizard.com/pw/medium/119b21b6ef26e5e228014d39ed998eee.jpg" style="margin: 0; width: 100%;" alt="" />
<p style="font-size: 12px; margin: 0;">PikWizard</p>
</a>
</span>
</span>
Free (free of charge)
Free for personal and commercial use.
Author: Awesome Content
Similar Free Stock Images

Premium


Premium


Premium


Premium


Premium


Premium


Premium


Premium


Premium


Premium


Premium


Premium


Premium


Premium


Premium


Premium


Premium


Premium


Premium


Premium


Premium


Premium


Premium


Premium

