
- Home >
- Stock Photos >
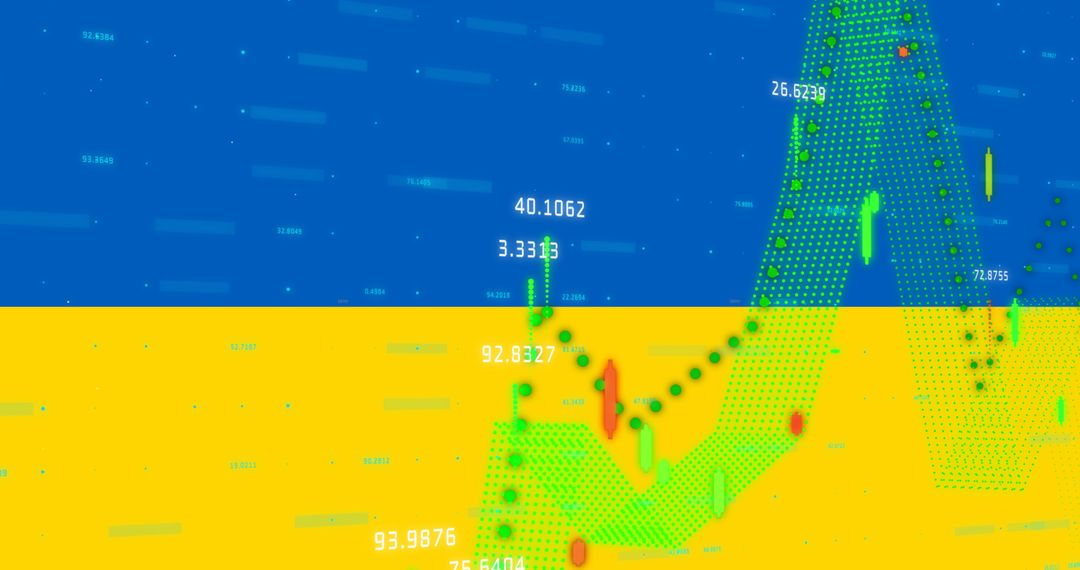
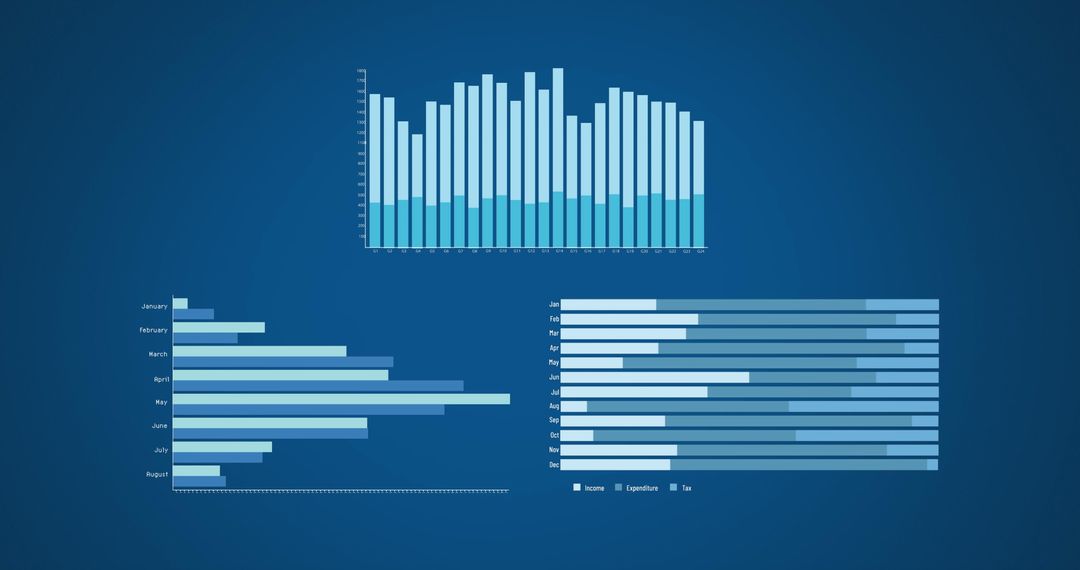
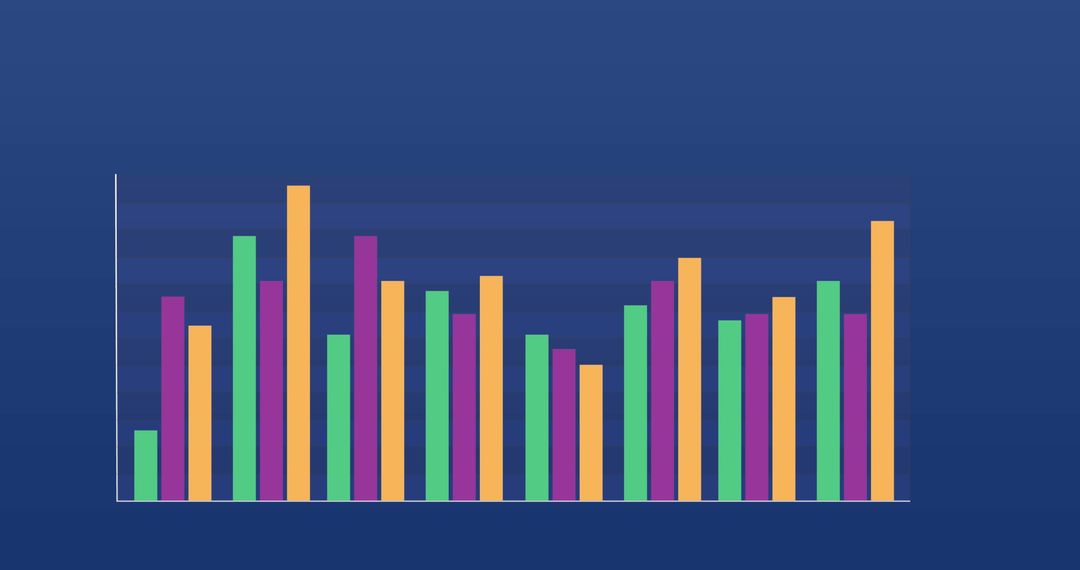
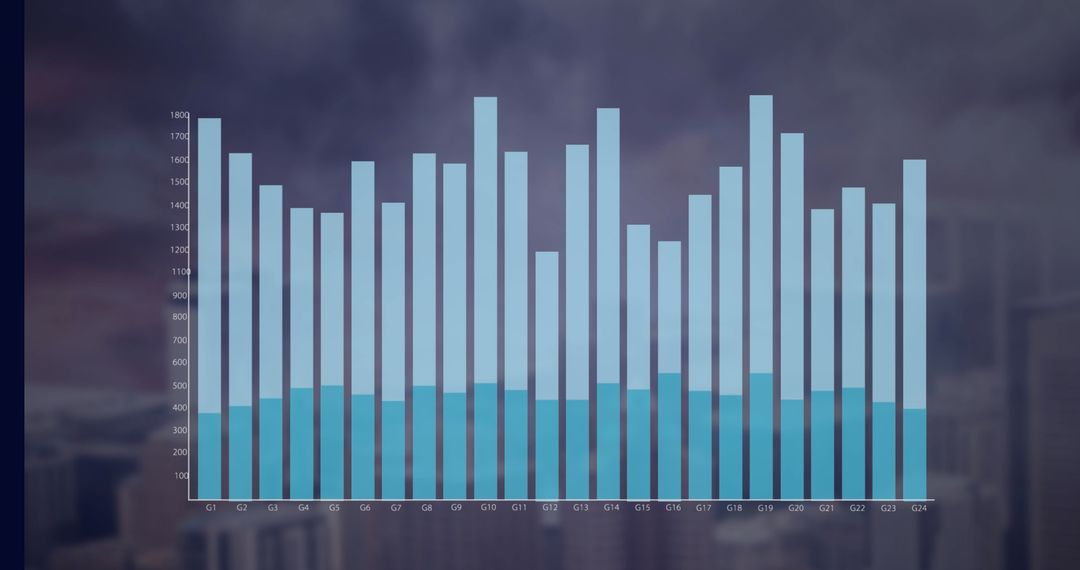
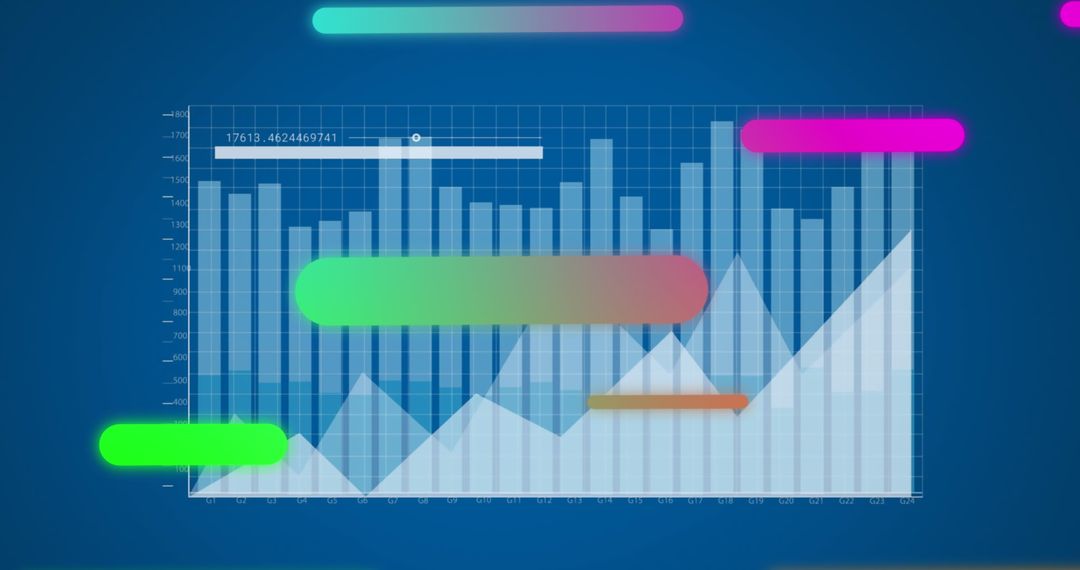
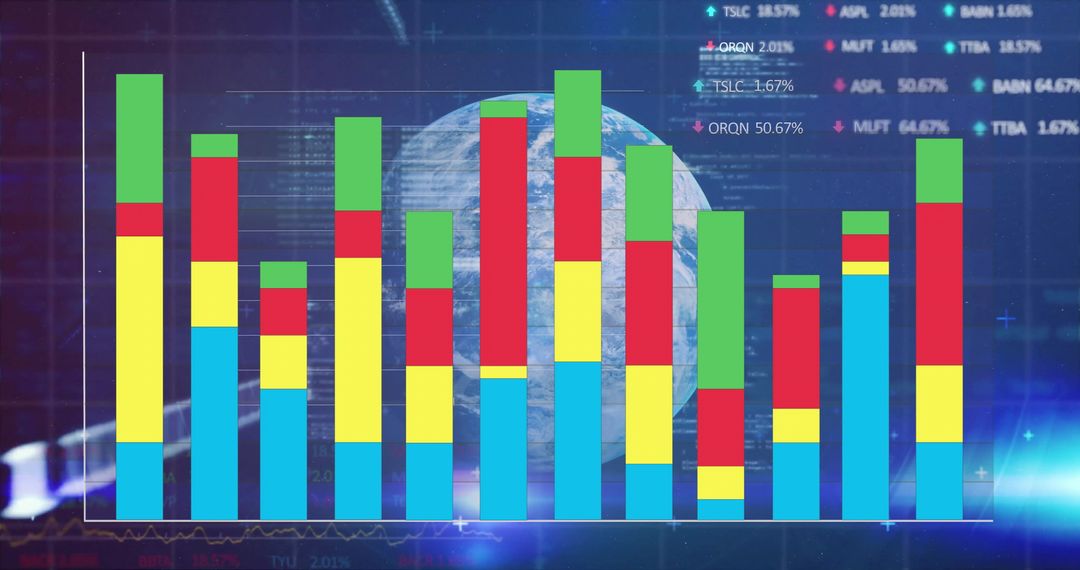
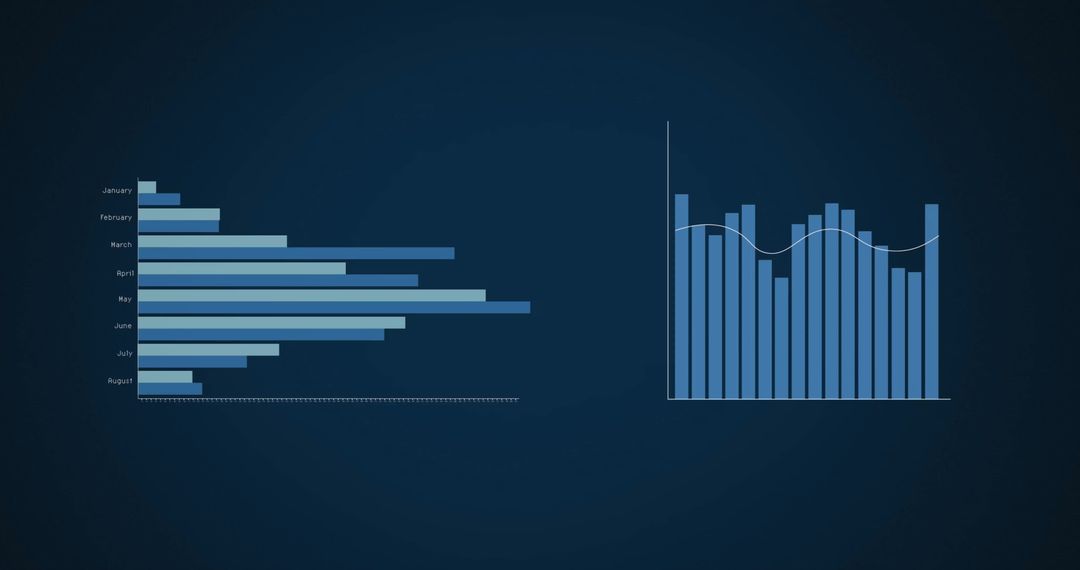
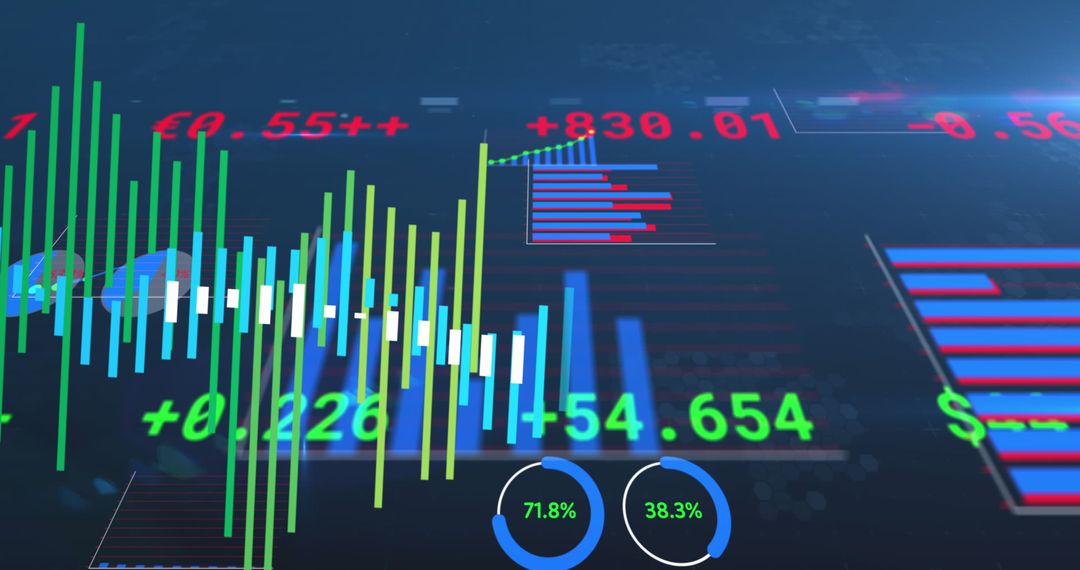
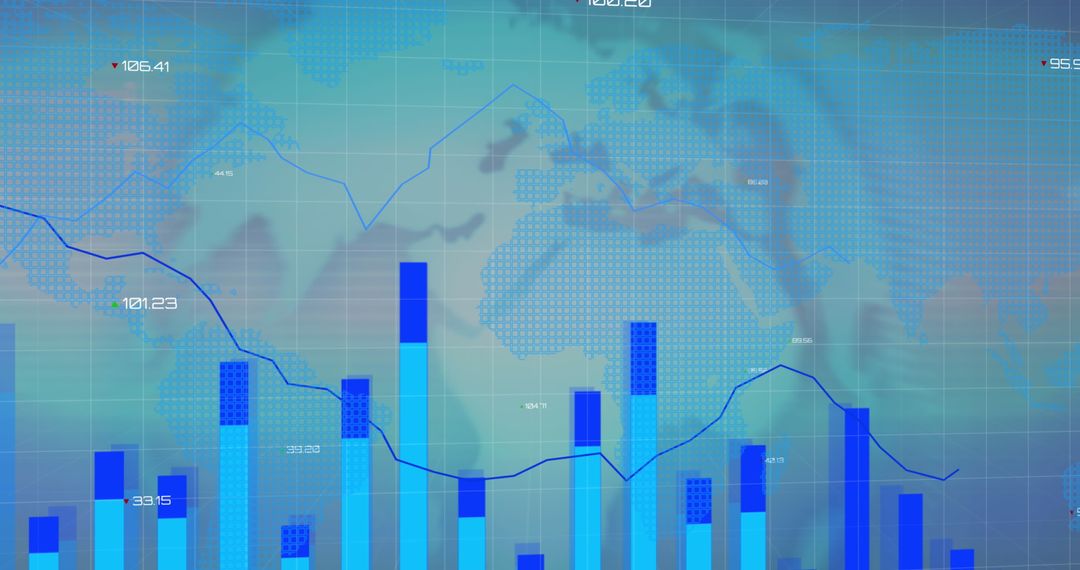
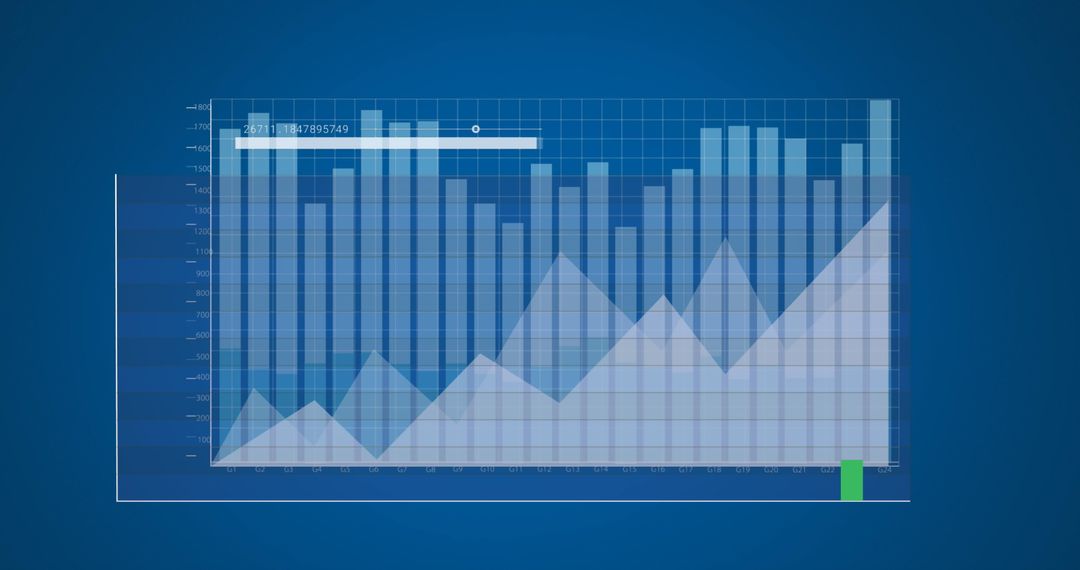
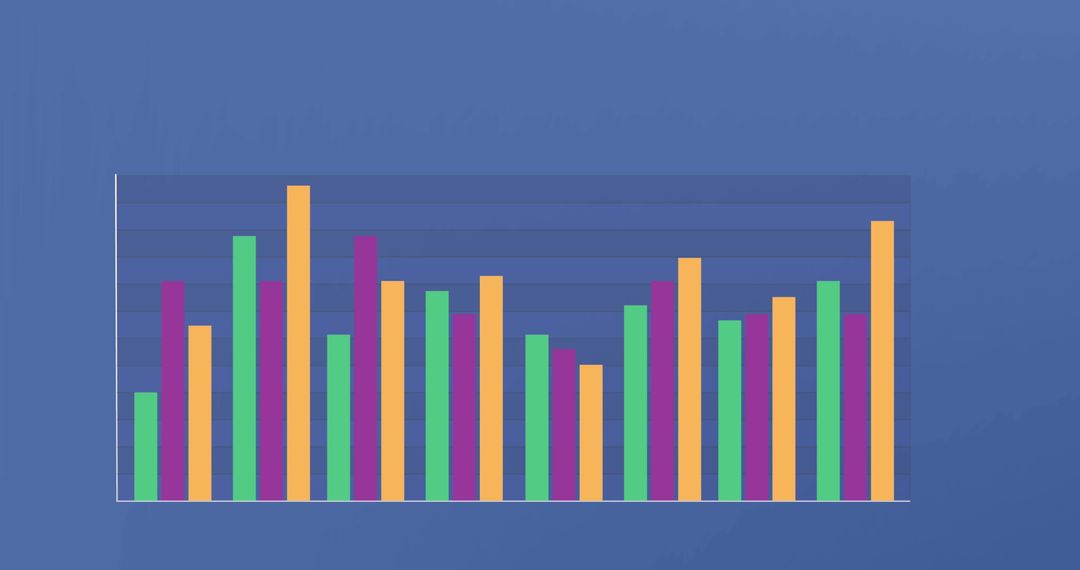
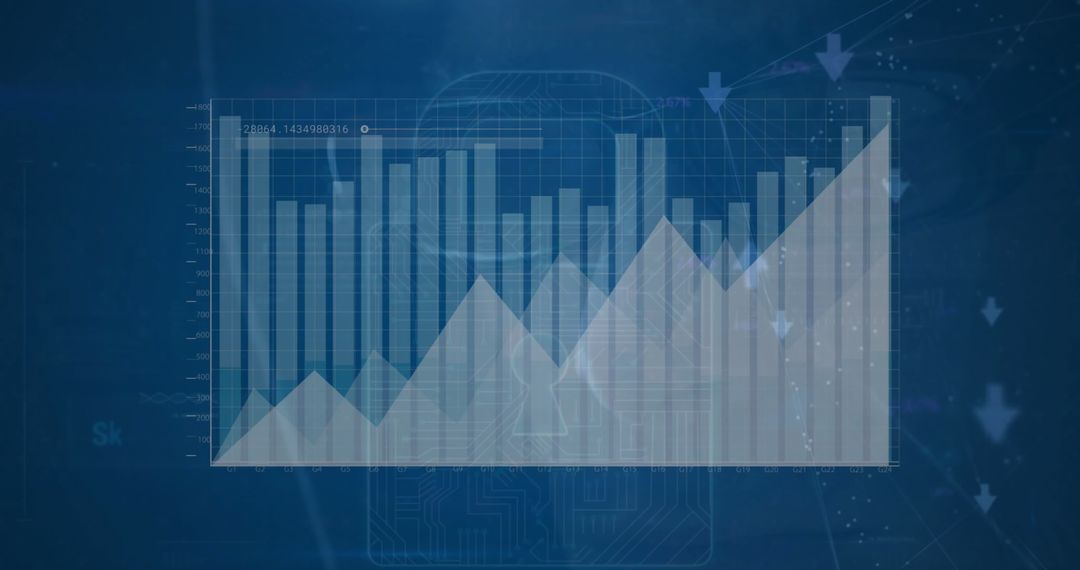
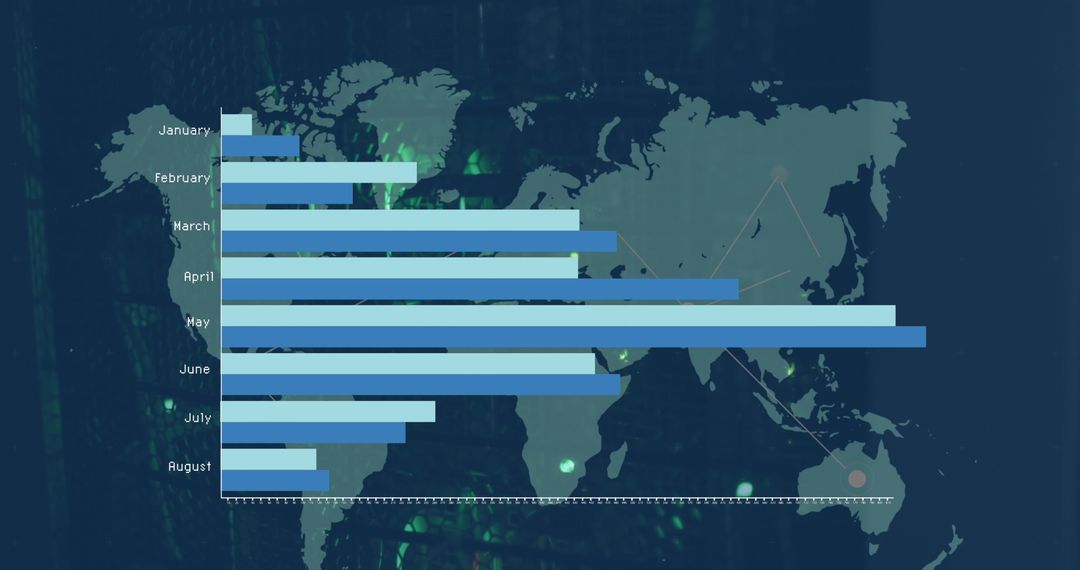
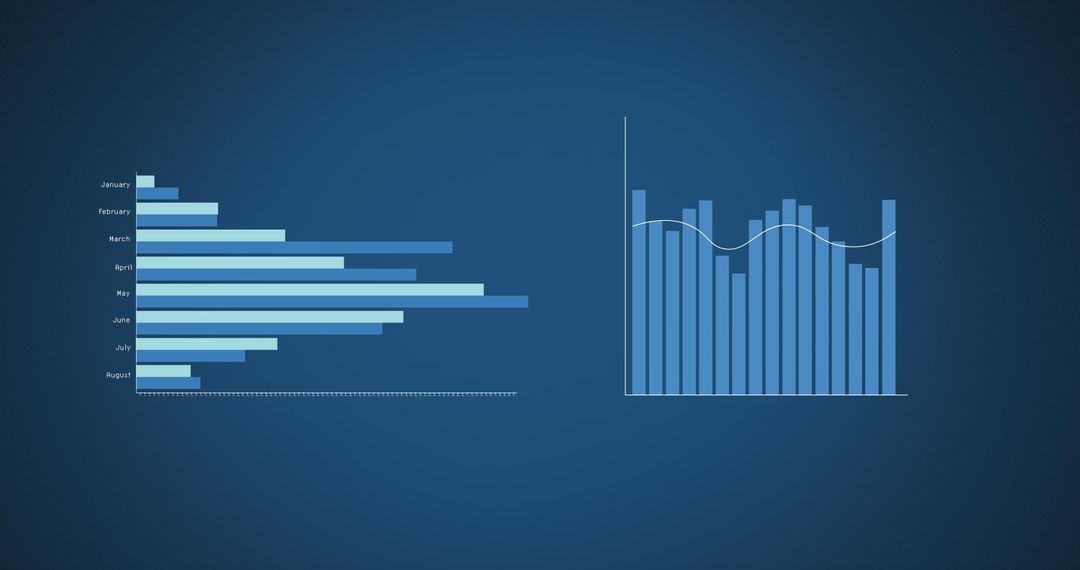
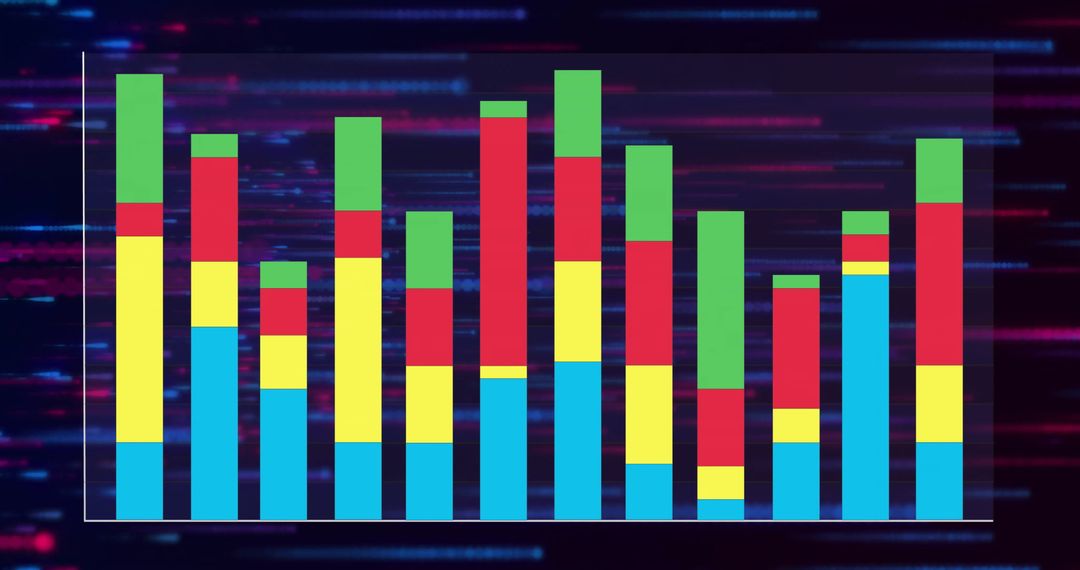
- Colorful Bar Chart Analyzing Data Trends on Digital Screen
Colorful Bar Chart Analyzing Data Trends on Digital Screen Image

Colorful bar chart displaying statistics against a blue background. Ideal for illustrating concepts in business analytics, data processing, and technology presentations. Useful for visuals in reports, educational materials, or articles about data trends and decision-making in business.
Powered by  - Get 15% off with code: PIKWIZARD15


10
downloads
downloads
Tags:
More
Credit Photo
If you would like to credit the Photo, here are some ways you can do so
Text Link
photo Link
<span class="text-link">
<span>
<a target="_blank" href=https://pikwizard.com/photo/colorful-bar-chart-analyzing-data-trends-on-digital-screen/76eb427c881ff092c8ca116363b015f9/>PikWizard</a>
</span>
</span>
<span class="image-link">
<span
style="margin: 0 0 20px 0; display: inline-block; vertical-align: middle; width: 100%;"
>
<a
target="_blank"
href="https://pikwizard.com/photo/colorful-bar-chart-analyzing-data-trends-on-digital-screen/76eb427c881ff092c8ca116363b015f9/"
style="text-decoration: none; font-size: 10px; margin: 0;"
>
<img src="https://pikwizard.com/pw/medium/76eb427c881ff092c8ca116363b015f9.jpg" style="margin: 0; width: 100%;" alt="" />
<p style="font-size: 12px; margin: 0;">PikWizard</p>
</a>
</span>
</span>
Free (free of charge)
Free for personal and commercial use.
Author: Authentic Images
Similar Free Stock Images

Premium


Premium


Premium


Premium


Premium


Premium


Premium


Premium


Premium

Premium


Premium


Premium


Premium


Premium


Premium
Premium


Premium


Premium


Premium


Premium


Premium


Premium


Premium


Premium

