
- Home >
- Stock Photos >
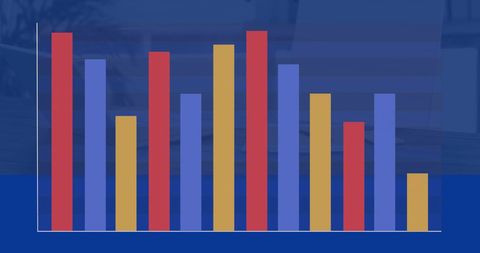
- Colorful Bar Chart Displayed Over Blue Background
Colorful Bar Chart Displayed Over Blue Background Image

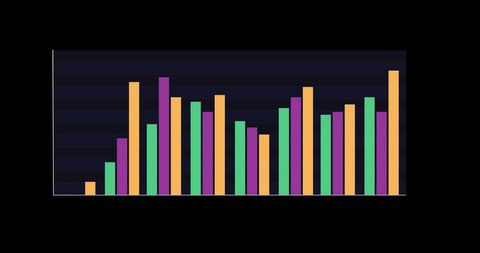
Vibrant bar chart showcasing statistical data with multiple colored bars over a gradient blue background. Ideal for presentations about data analysis, technology in business, or statistical comparison. Useful in editorials about business analytics, exploring trends, or reporting technological insights.
Powered by  - Get 15% off with code: PIKWIZARD15


downloads
Tags:
More
Credit Photo
If you would like to credit the Photo, here are some ways you can do so
Text Link
photo Link
<span class="text-link">
<span>
<a target="_blank" href=https://pikwizard.com/photo/colorful-bar-chart-displayed-over-blue-background/c305da318b23233bd0cae151f2d8f7e8/>PikWizard</a>
</span>
</span>
<span class="image-link">
<span
style="margin: 0 0 20px 0; display: inline-block; vertical-align: middle; width: 100%;"
>
<a
target="_blank"
href="https://pikwizard.com/photo/colorful-bar-chart-displayed-over-blue-background/c305da318b23233bd0cae151f2d8f7e8/"
style="text-decoration: none; font-size: 10px; margin: 0;"
>
<img src="https://pikwizard.com/pw/medium/c305da318b23233bd0cae151f2d8f7e8.jpg" style="margin: 0; width: 100%;" alt="" />
<p style="font-size: 12px; margin: 0;">PikWizard</p>
</a>
</span>
</span>
Free (free of charge)
Free for personal and commercial use.
Author: Creative Art
Similar Free Stock Images
Loading...

Premium


Premium

Premium

Premium


Premium


Premium

Premium


Premium


Premium


Premium


Premium

Premium

Premium


Premium

Premium


Premium


Premium


Premium


Premium


Premium

Premium


Premium

Premium


Premium

Premium


