
- Home >
- Stock Photos >
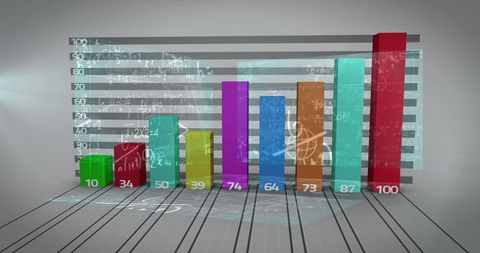
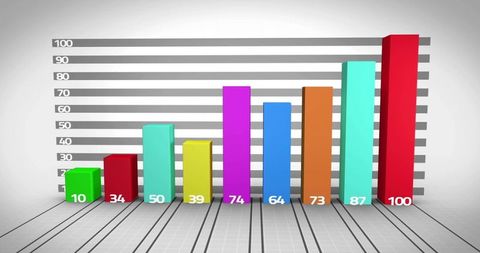
- Colorful Bar Chart with Rising Columns Visualization
Colorful Bar Chart with Rising Columns Visualization Image
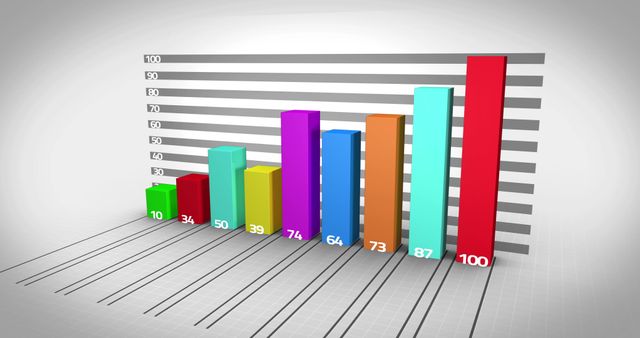
Colorful bar chart represents data trends with rising columns against a grid background. Useful for presentations, infographics, and reports focusing on data growth, statistical analysis, and business insights.
Powered by  - Get 15% off with code: PIKWIZARD15


Credit Photo
If you would like to credit the Photo, here are some ways you can do so
Text Link
photo Link
<span class="text-link">
<span>
<a target="_blank" href=https://pikwizard.com/photo/colorful-bar-chart-with-rising-columns-visualization/ed653a12e1d824947577dced24e79970/>PikWizard</a>
</span>
</span>
<span class="image-link">
<span
style="margin: 0 0 20px 0; display: inline-block; vertical-align: middle; width: 100%;"
>
<a
target="_blank"
href="https://pikwizard.com/photo/colorful-bar-chart-with-rising-columns-visualization/ed653a12e1d824947577dced24e79970/"
style="text-decoration: none; font-size: 10px; margin: 0;"
>
<img src="https://pikwizard.com/pw/medium/ed653a12e1d824947577dced24e79970.jpg" style="margin: 0; width: 100%;" alt="" />
<p style="font-size: 12px; margin: 0;">PikWizard</p>
</a>
</span>
</span>
Free (free of charge)
Free for personal and commercial use.
Author: Awesome Content
Similar Free Stock Images

Premium

Premium


Premium

Premium


Premium


Premium


AI


AI


Premium


Premium


Premium

Premium


Premium


Premium

Premium


AI

Premium

AI


Premium


Premium

AI


Premium

AI


Premium

AI


AI

Premium


Premium


Premium

Premium

Premium


AI

Premium


AI


AI

Premium


Explore More Free Stock Images