
- Home >
- Stock Photos >
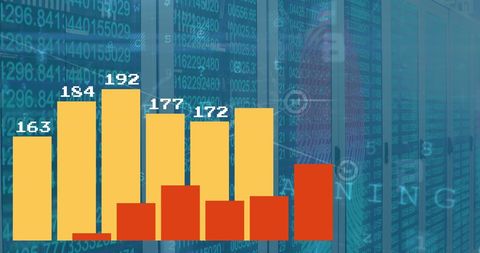
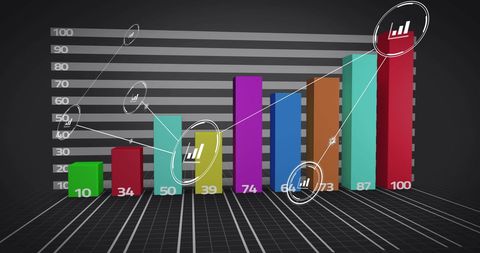
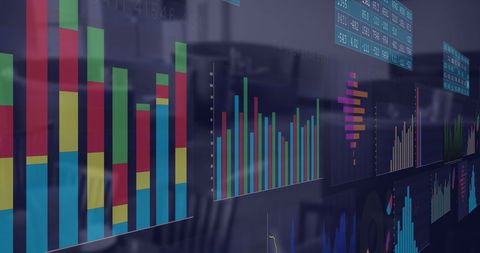
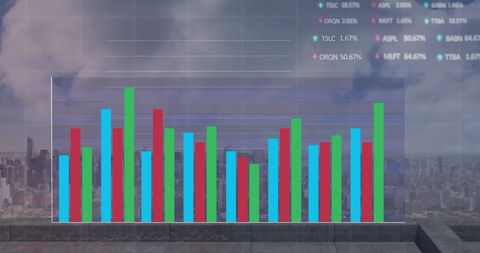
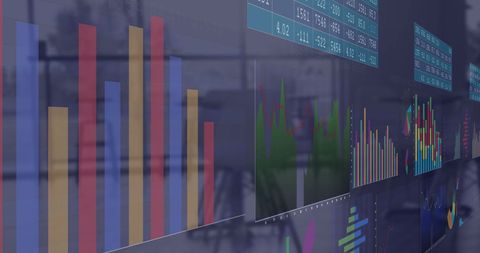
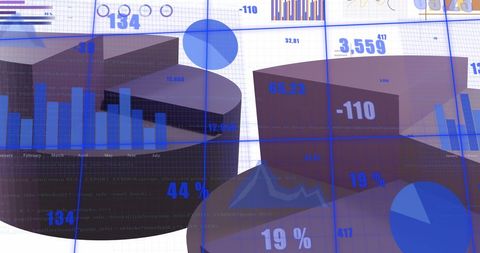
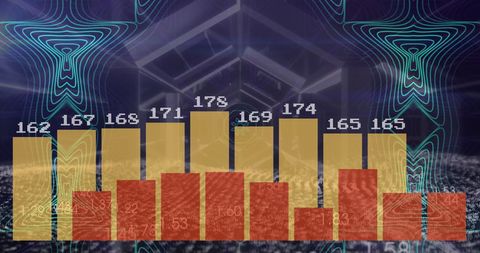
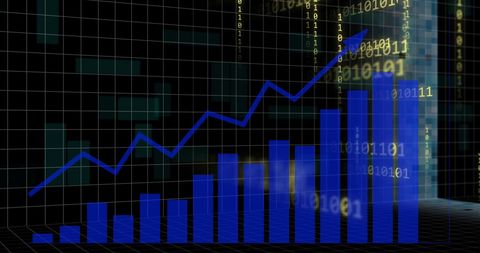
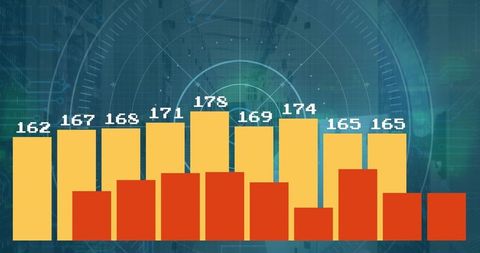
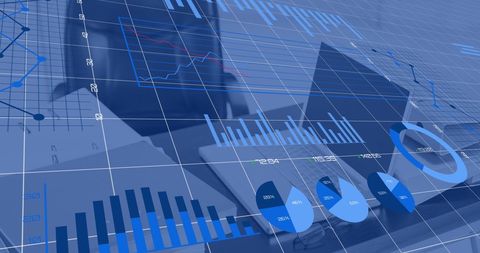
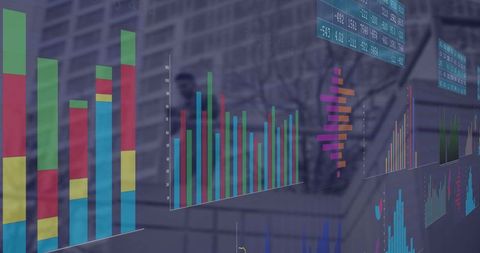
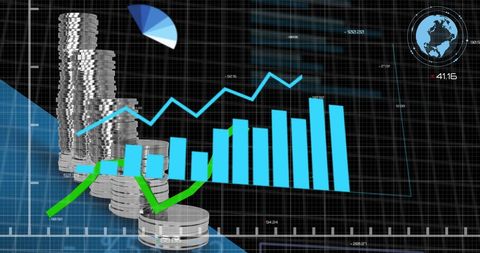
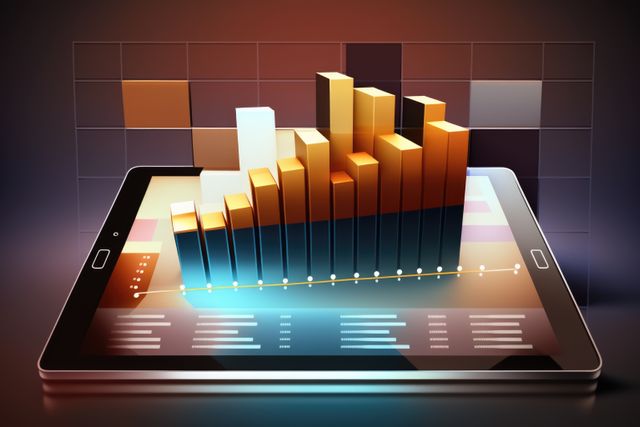
- Colorful Bar Graph Analyzing Financial Data Trends
Colorful Bar Graph Analyzing Financial Data Trends Image
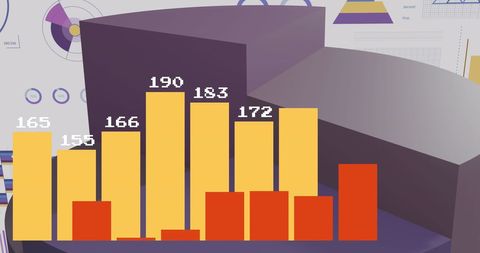
Vibrant bar graph illustrating trends in financial data. Useful for articles or presentations on business growth, economic analysis, or financial strategies. Suitable for educational content about financial statistics and data visualization.

downloads
Tags:
More
Credit Photo
If you would like to credit the Photo, here are some ways you can do so
Text Link
photo Link
<span class="text-link">
<span>
<a target="_blank" href=https://pikwizard.com/photo/colorful-bar-graph-analyzing-financial-data-trends/a04bb3026cb790ae6cfce201eb0a4b87/>PikWizard</a>
</span>
</span>
<span class="image-link">
<span
style="margin: 0 0 20px 0; display: inline-block; vertical-align: middle; width: 100%;"
>
<a
target="_blank"
href="https://pikwizard.com/photo/colorful-bar-graph-analyzing-financial-data-trends/a04bb3026cb790ae6cfce201eb0a4b87/"
style="text-decoration: none; font-size: 10px; margin: 0;"
>
<img src="https://pikwizard.com/pw/medium/a04bb3026cb790ae6cfce201eb0a4b87.jpg" style="margin: 0; width: 100%;" alt="" />
<p style="font-size: 12px; margin: 0;">PikWizard</p>
</a>
</span>
</span>
Free (free of charge)
Free for personal and commercial use.
Author: Awesome Content
Similar Free Stock Images


AI


AI


AI


AI

AI


Explore More Free Stock Images