- Home >
- Stock Photos >
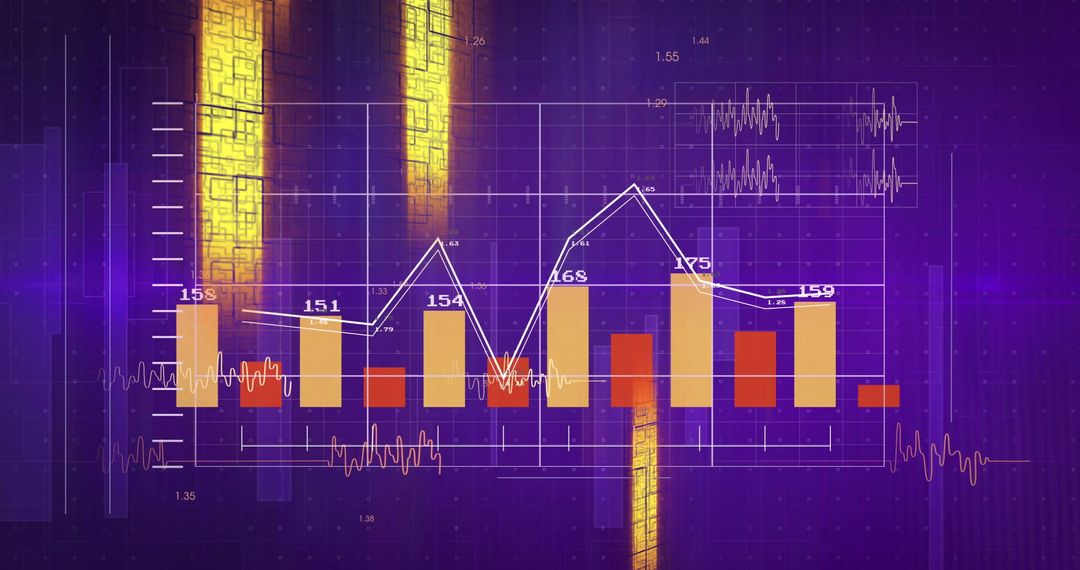
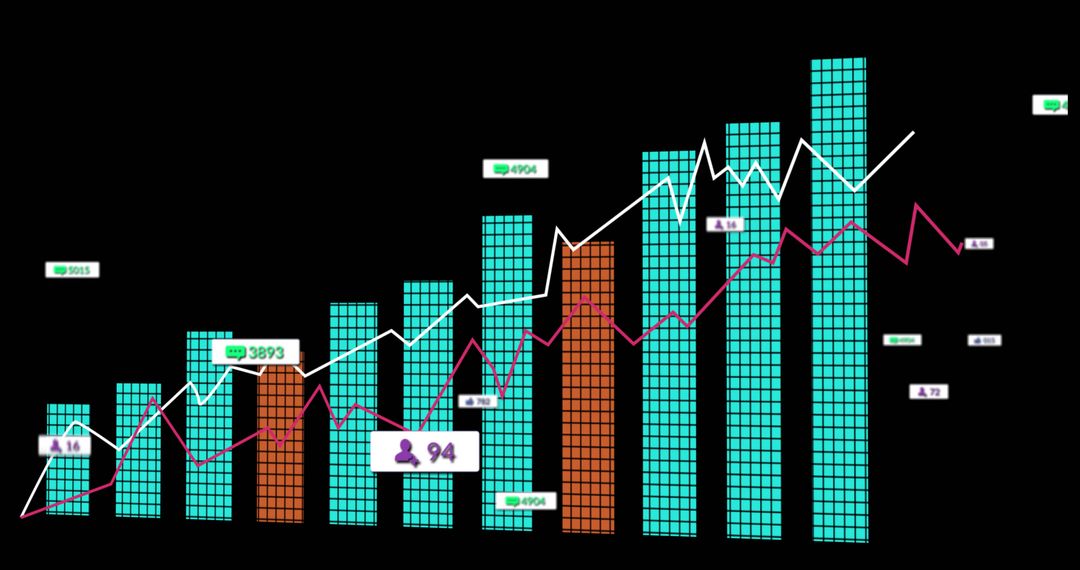
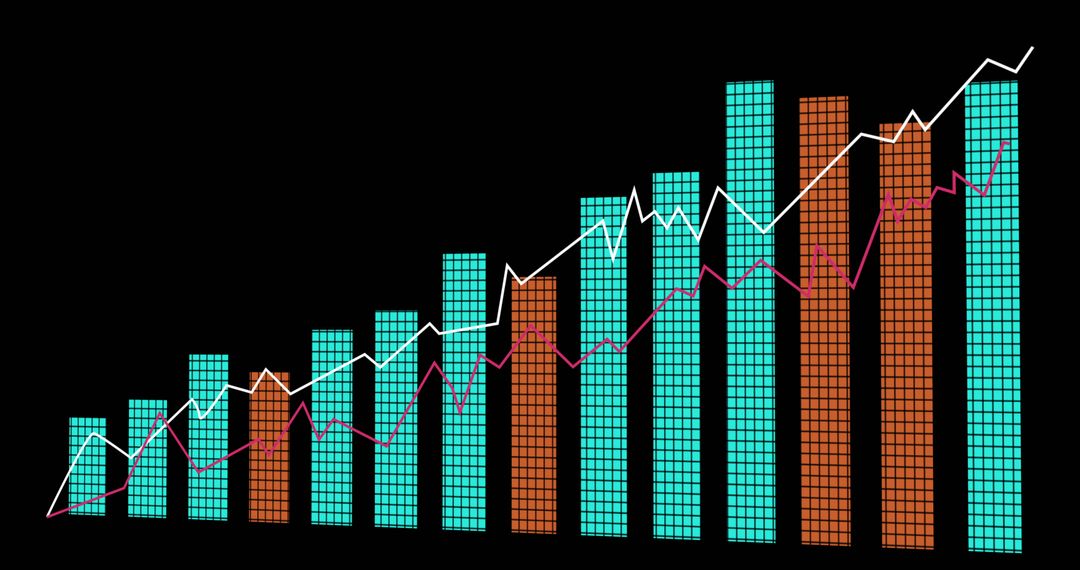
- Colorful Bar Graph and Line Chart Analysis in Digital Format
Colorful Bar Graph and Line Chart Analysis in Digital Format Image
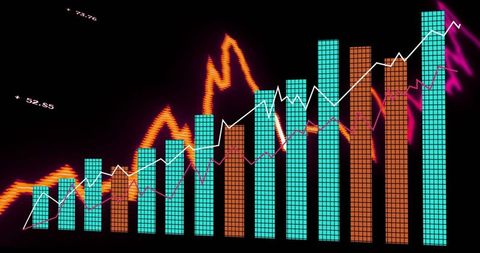
Vivid statistical graph merges teal and orange bars with dynamic white, magenta, and orange lines, representing various financial or data metrics. Numeric details add a modernized touch essential for presentations and financial comparisons. Ideal in contexts of data analytics discussions, business growth strategies, or technology trend analysis scenarios.
Powered by 


0
downloads
downloads
Tags:
More
Credit Photo
If you would like to credit the Photo, here are some ways you can do so
Text Link
photo Link
<span class="text-link">
<span>
<a target="_blank" href=https://pikwizard.com/photo/colorful-bar-graph-and-line-chart-analysis-in-digital-format/61e9a361308853e7bfca6f10b14514e2/>PikWizard</a>
</span>
</span>
<span class="image-link">
<span
style="margin: 0 0 20px 0; display: inline-block; vertical-align: middle; width: 100%;"
>
<a
target="_blank"
href="https://pikwizard.com/photo/colorful-bar-graph-and-line-chart-analysis-in-digital-format/61e9a361308853e7bfca6f10b14514e2/"
style="text-decoration: none; font-size: 10px; margin: 0;"
>
<img src="https://pikwizard.com/pw/medium/61e9a361308853e7bfca6f10b14514e2.jpg" style="margin: 0; width: 100%;" alt="" />
<p style="font-size: 12px; margin: 0;">PikWizard</p>
</a>
</span>
</span>
Free (free of charge)
Free for personal and commercial use.
Author: Creative Art
Similar Free Stock Images

Premium


Premium


Premium


Premium


Premium


Premium


Premium


Premium


Premium


Premium


Premium


Premium


Premium


Premium


Premium


Premium


Premium


Premium


Premium


Premium


Premium


Premium


Premium


Premium