- Home >
- Stock Photos >
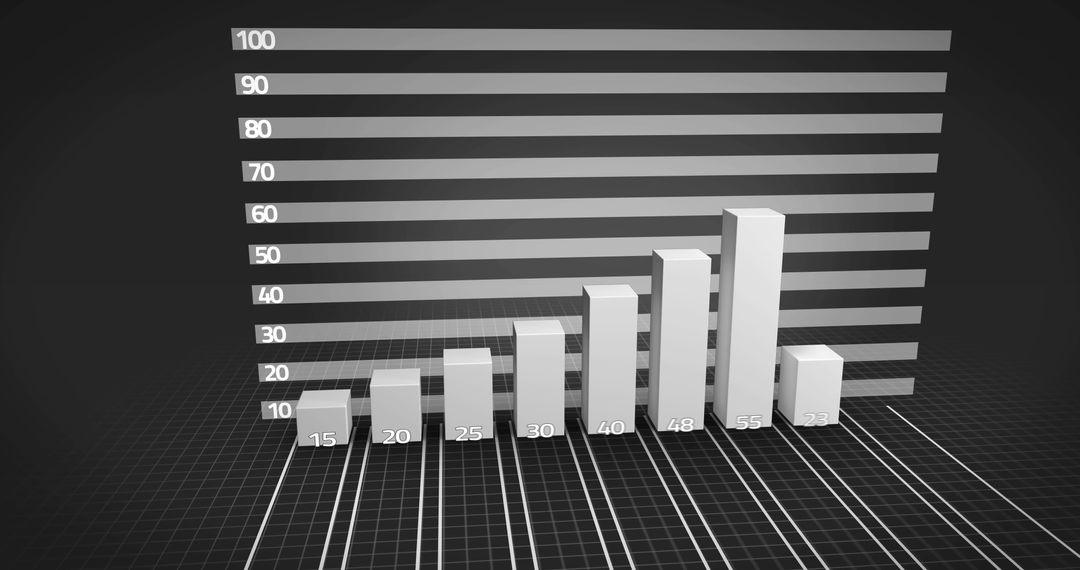
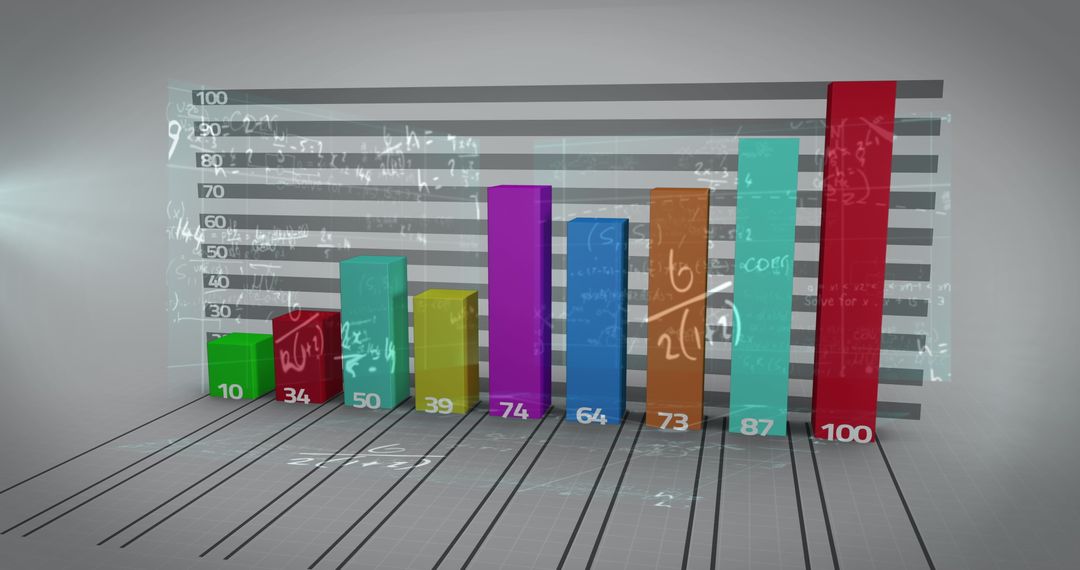
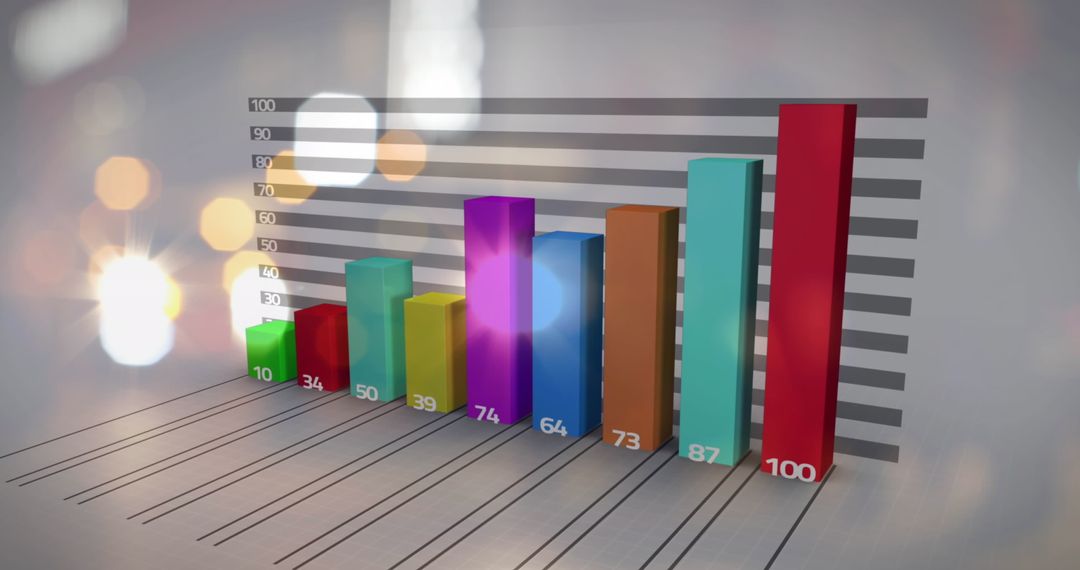
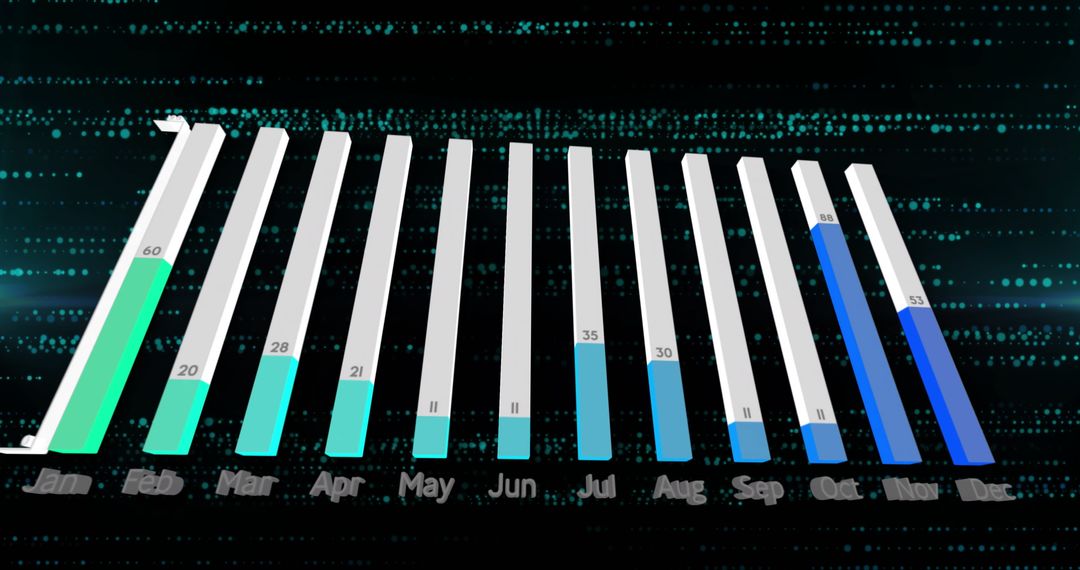
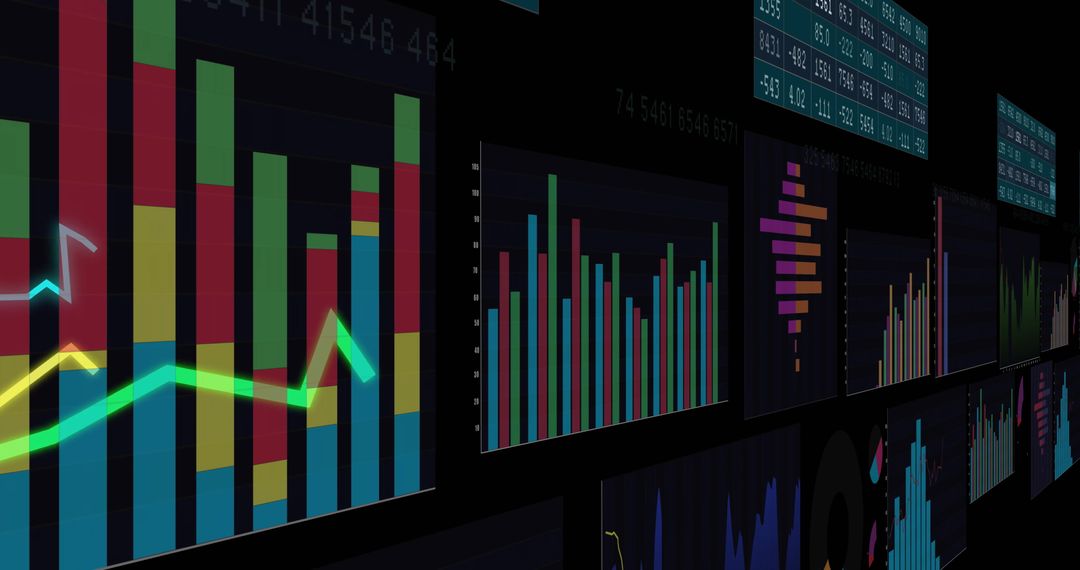
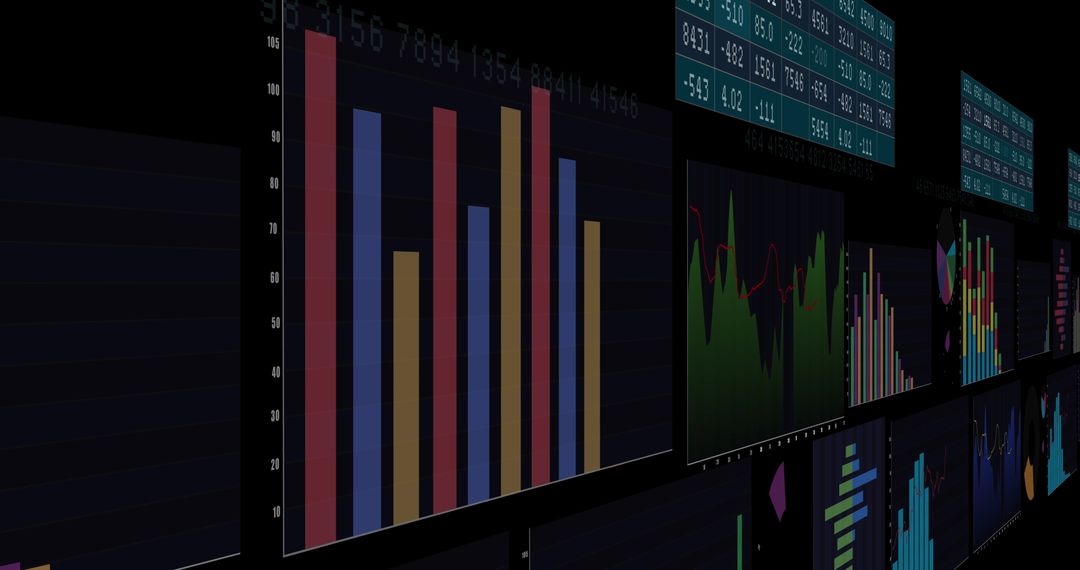
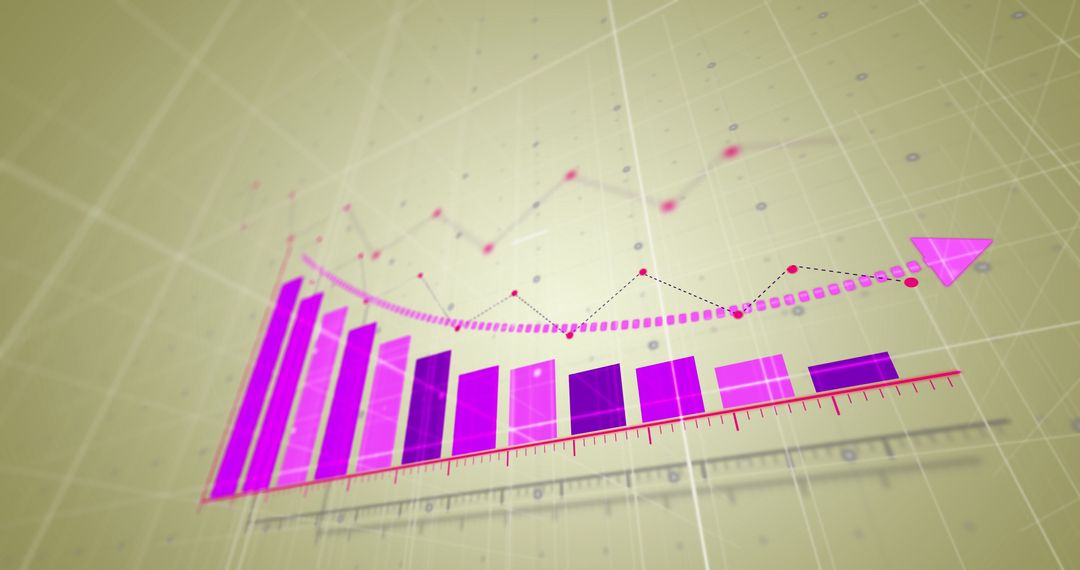
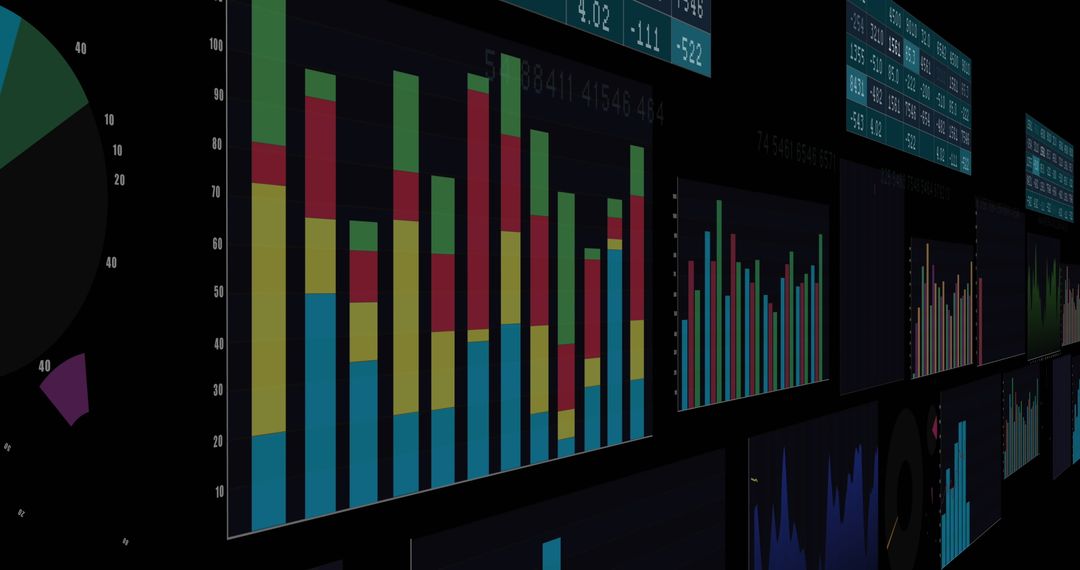
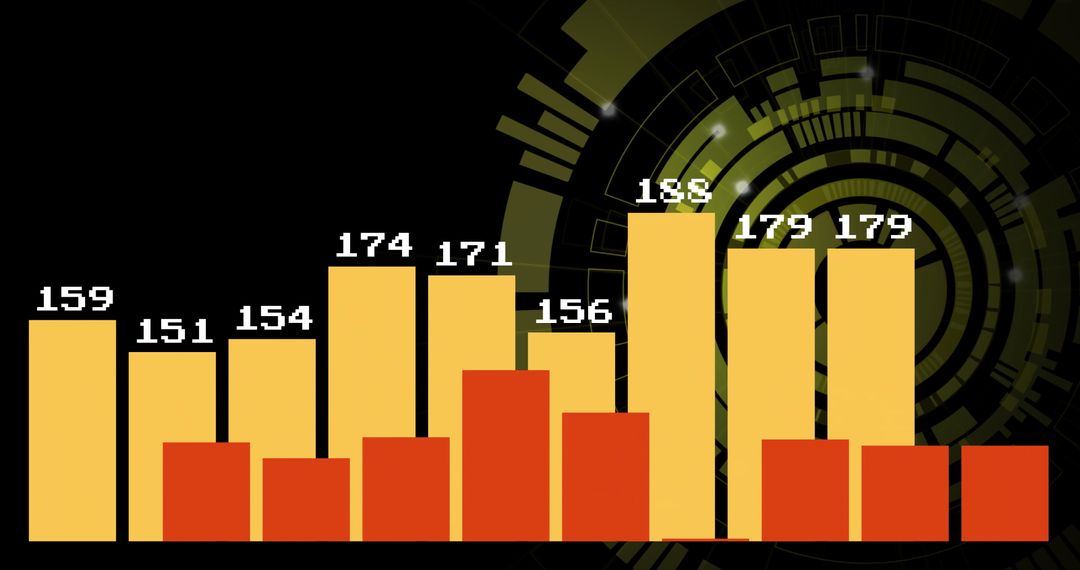
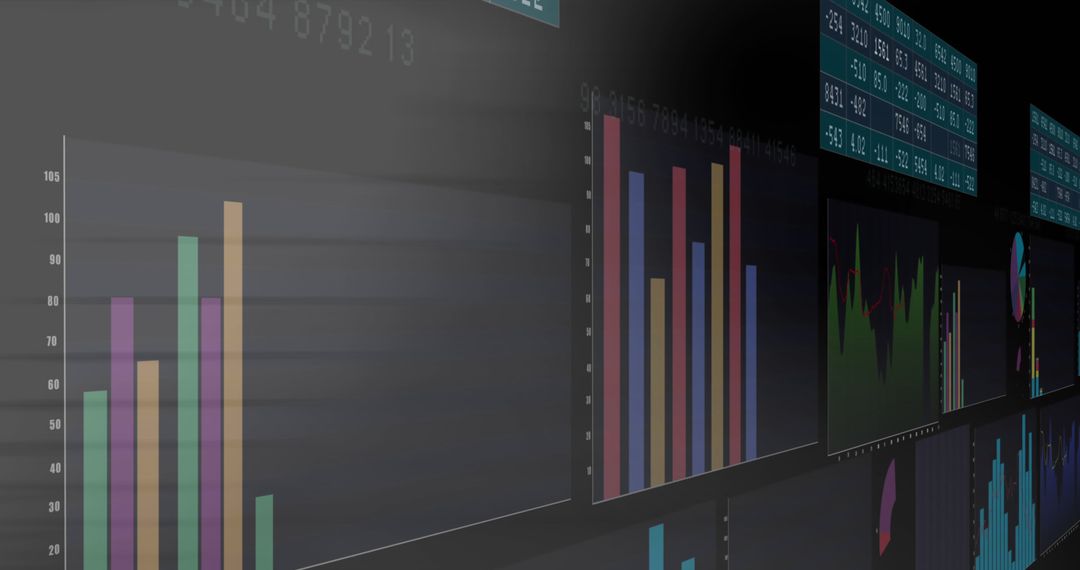
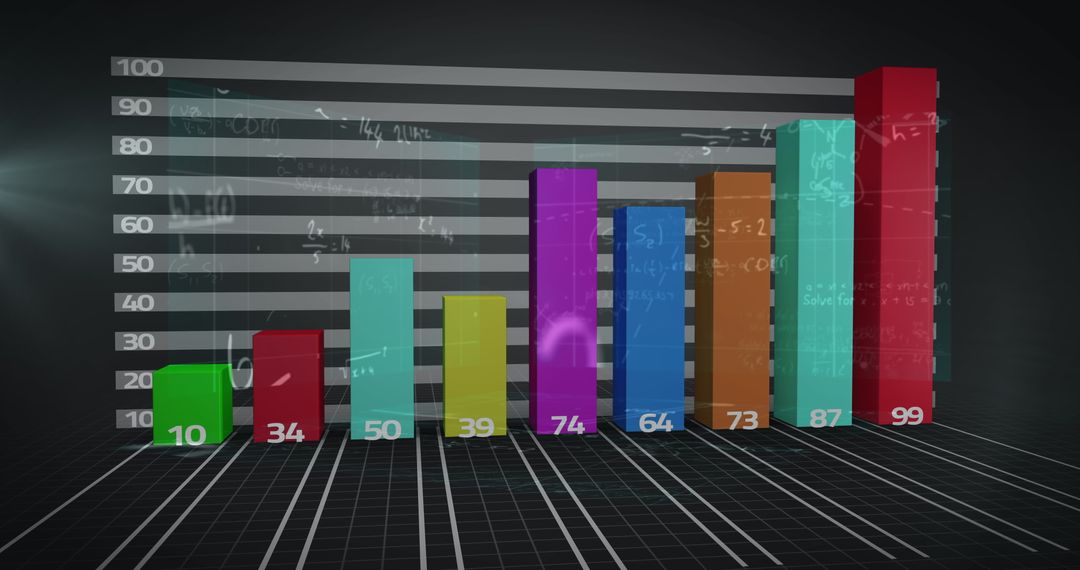
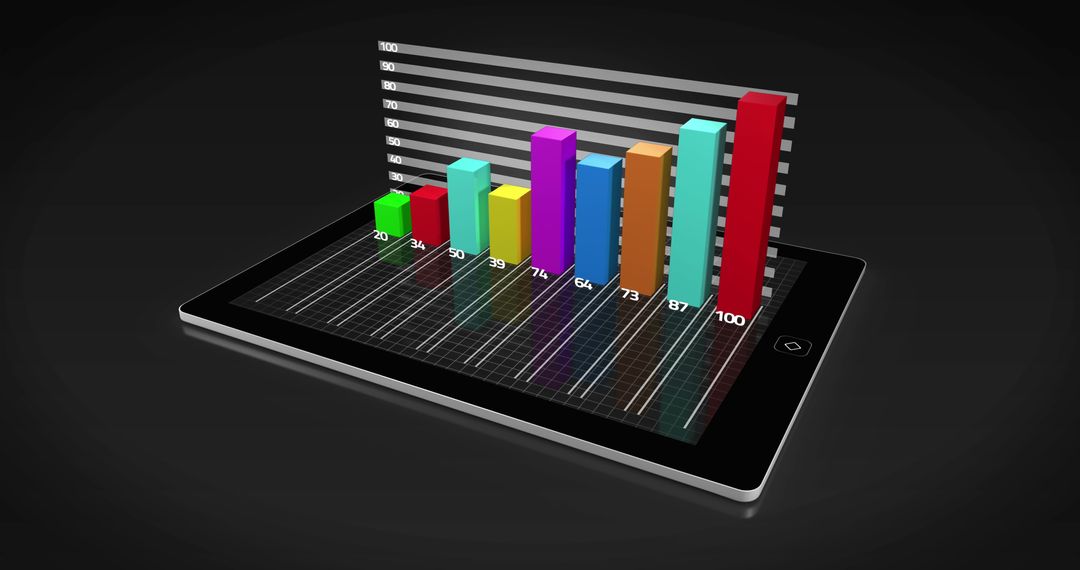
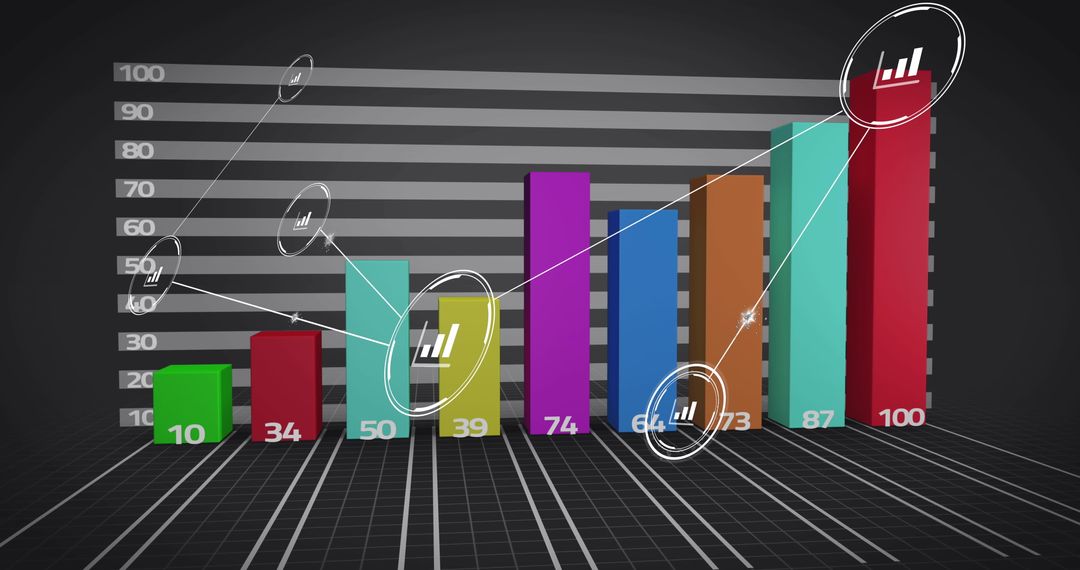
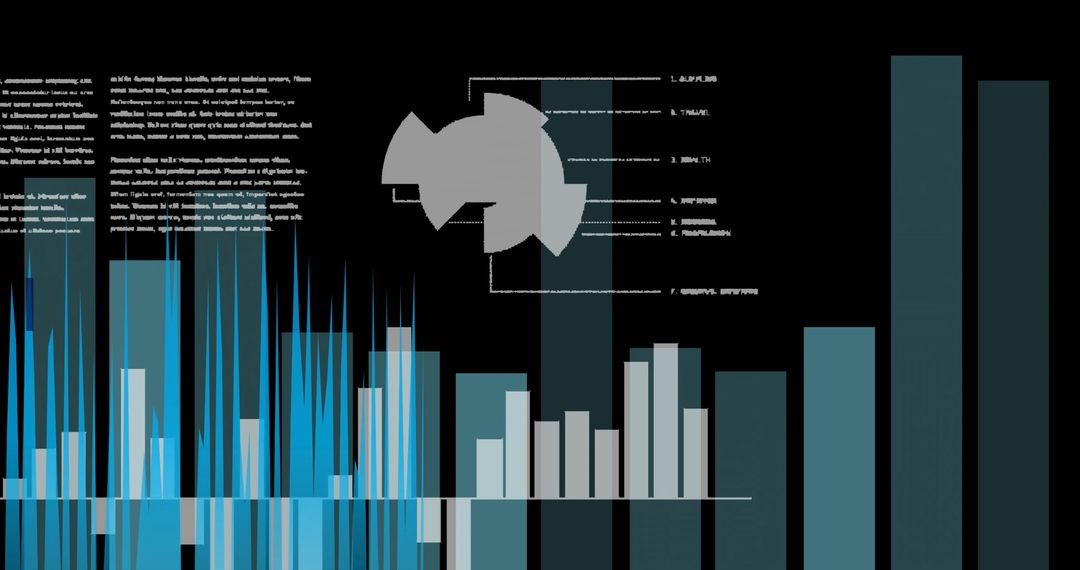
- Colorful Bar Graph on Dark Background Illustrating Growth
Colorful Bar Graph on Dark Background Illustrating Growth Image
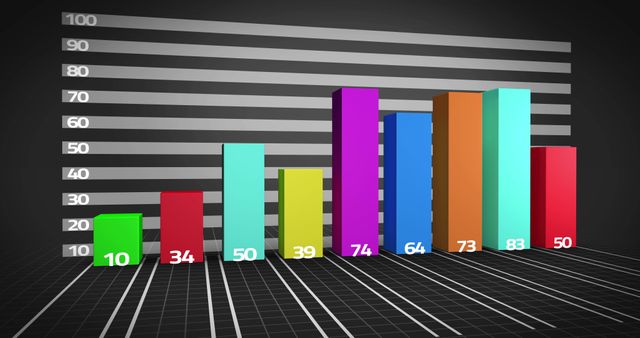
Vibrant bar graph vividly portrays business growth and data metrics against a striking black background. Ideal for use in presentations, report covers, or articles focusing on business analytics, statistical reports, and data-driven decision-making.
Powered by 


7
downloads
downloads
Tags:
More
Credit Photo
If you would like to credit the Photo, here are some ways you can do so
Text Link
photo Link
<span class="text-link">
<span>
<a target="_blank" href=https://pikwizard.com/photo/colorful-bar-graph-on-dark-background-illustrating-growth/6d47ae816c8f0e1f3ab51e5f68aff162/>PikWizard</a>
</span>
</span>
<span class="image-link">
<span
style="margin: 0 0 20px 0; display: inline-block; vertical-align: middle; width: 100%;"
>
<a
target="_blank"
href="https://pikwizard.com/photo/colorful-bar-graph-on-dark-background-illustrating-growth/6d47ae816c8f0e1f3ab51e5f68aff162/"
style="text-decoration: none; font-size: 10px; margin: 0;"
>
<img src="https://pikwizard.com/pw/medium/6d47ae816c8f0e1f3ab51e5f68aff162.jpg" style="margin: 0; width: 100%;" alt="" />
<p style="font-size: 12px; margin: 0;">PikWizard</p>
</a>
</span>
</span>
Free (free of charge)
Free for personal and commercial use.
Author: Authentic Images
Similar Free Stock Images

Premium


Premium


Premium


Premium


Premium


Premium


Premium


Premium


Premium


Premium


Premium


Premium


Premium


Premium


Premium


Premium


Premium


Premium


Premium


Premium


Premium


Premium


Premium


Premium