- Home >
- Stock Photos >
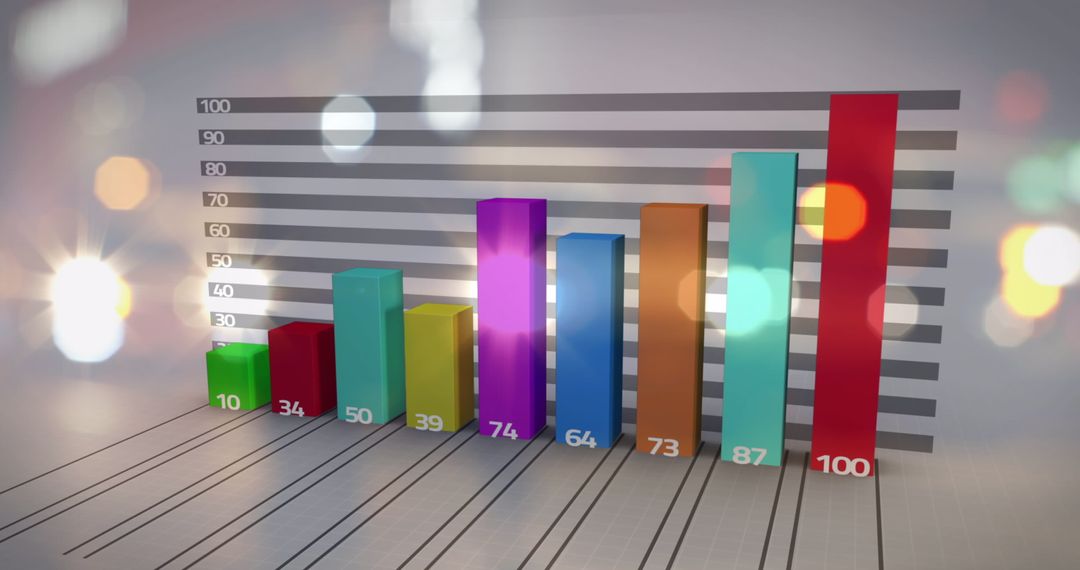
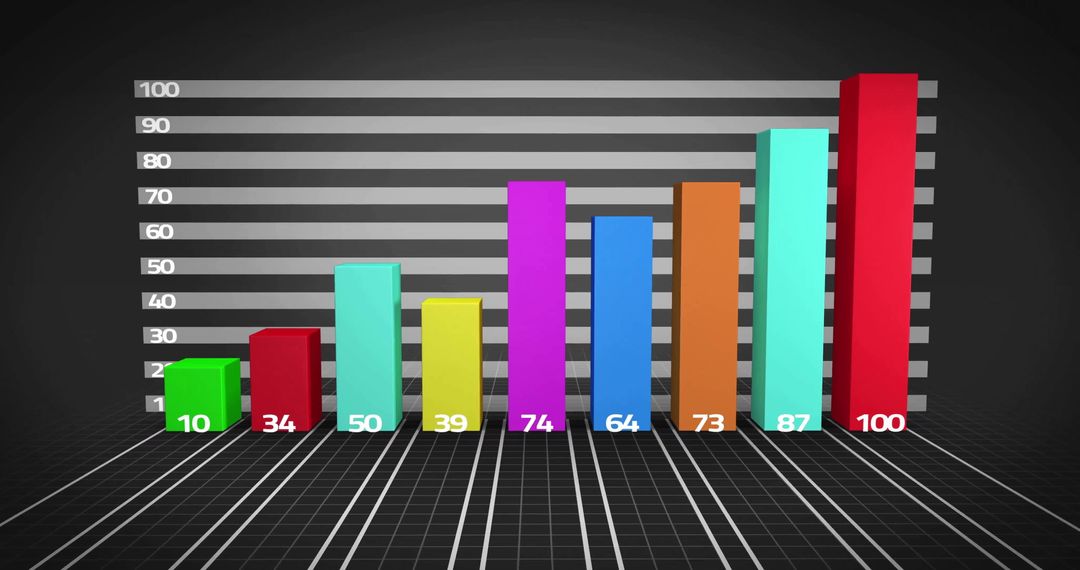
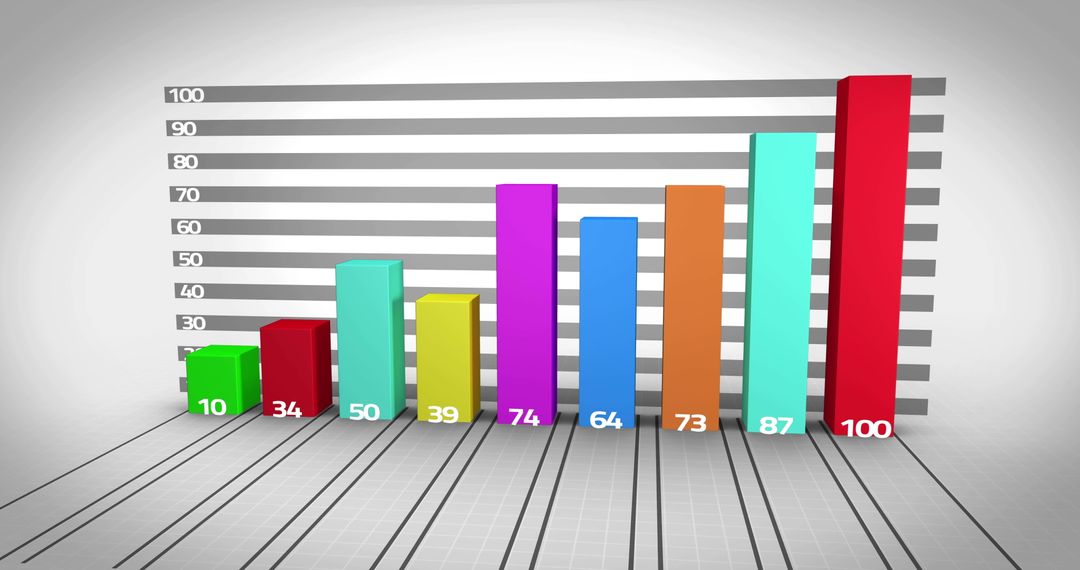
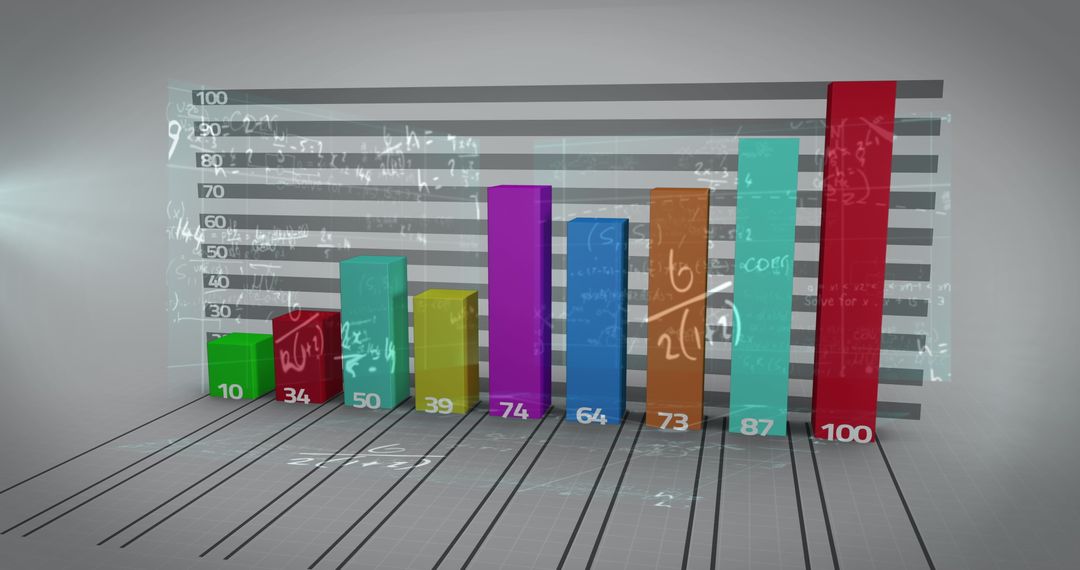
- Colorful Bar Graph Over Contrasted Mathematical Equations
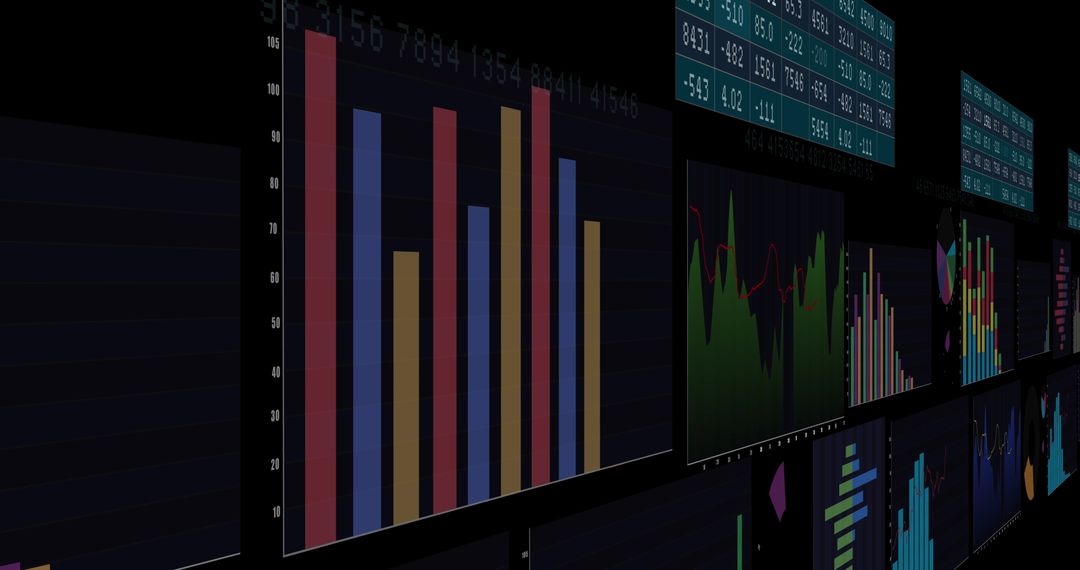
Colorful Bar Graph Over Contrasted Mathematical Equations Image
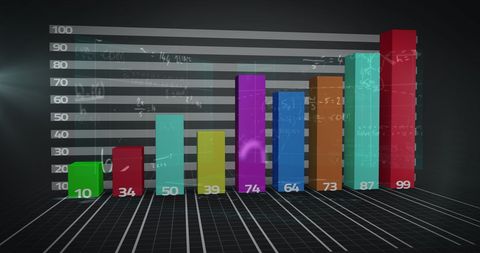
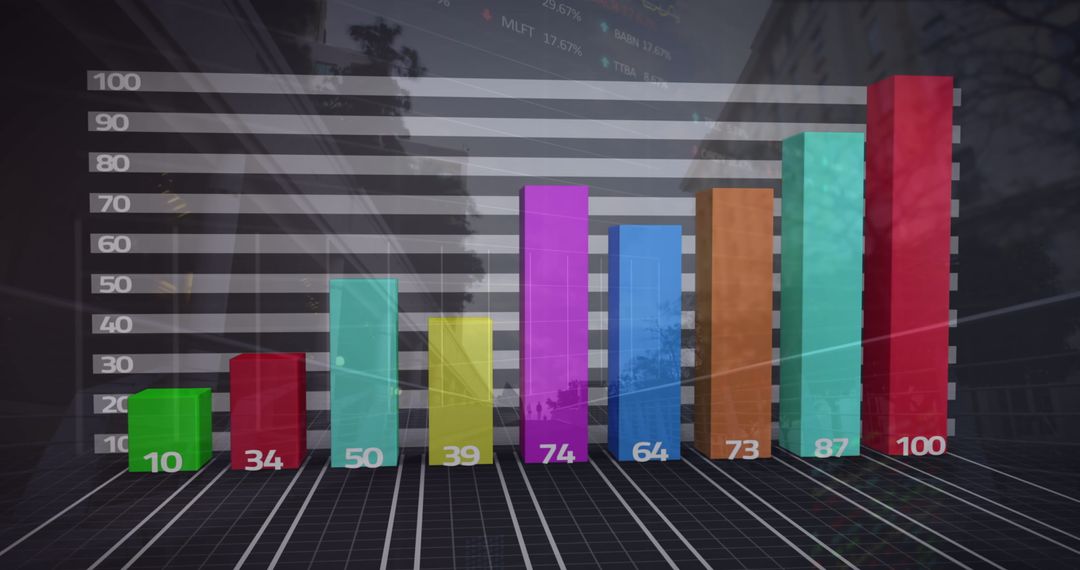
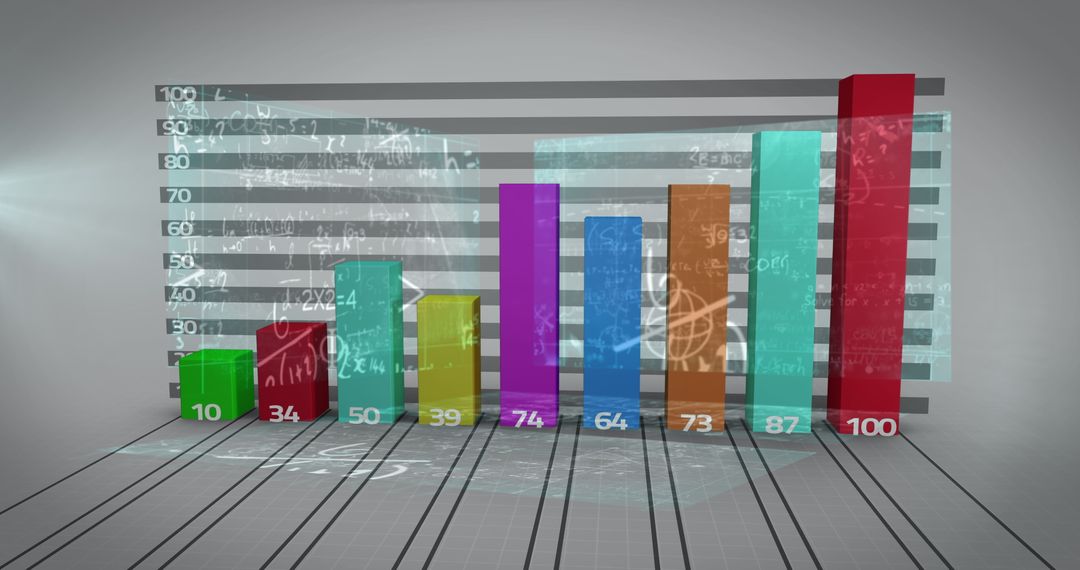
Graphical representation of financial data using a colorful bar graph set against a backdrop of mathematical equations. The vibrant bars contrast starkly with the black of the equation-filled background, suggesting complex data analysis in financial contexts. Useful for animations, presentations, or teaching materials related to finance, data analytics, or mathematics education.
Powered by  - Get 15% off with code: PIKWIZARD15


2
downloads
downloads
Tags:
More
Credit Photo
If you would like to credit the Photo, here are some ways you can do so
Text Link
photo Link
<span class="text-link">
<span>
<a target="_blank" href=https://pikwizard.com/photo/colorful-bar-graph-over-contrasted-mathematical-equations/060f86f331751ba9dcff53b2f69e0852/>PikWizard</a>
</span>
</span>
<span class="image-link">
<span
style="margin: 0 0 20px 0; display: inline-block; vertical-align: middle; width: 100%;"
>
<a
target="_blank"
href="https://pikwizard.com/photo/colorful-bar-graph-over-contrasted-mathematical-equations/060f86f331751ba9dcff53b2f69e0852/"
style="text-decoration: none; font-size: 10px; margin: 0;"
>
<img src="https://pikwizard.com/pw/medium/060f86f331751ba9dcff53b2f69e0852.jpg" style="margin: 0; width: 100%;" alt="" />
<p style="font-size: 12px; margin: 0;">PikWizard</p>
</a>
</span>
</span>
Free (free of charge)
Free for personal and commercial use.
Author: Authentic Images
Similar Free Stock Images
Premium


Premium


Premium


Premium


Premium


Premium


Premium


Premium


Premium


Premium


Premium


Premium


Premium


Premium


Premium


Premium


Premium


Premium


Premium


Premium


Premium


Premium


Premium


Premium