- Home >
- Stock Photos >
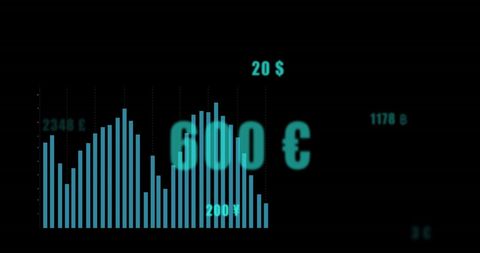
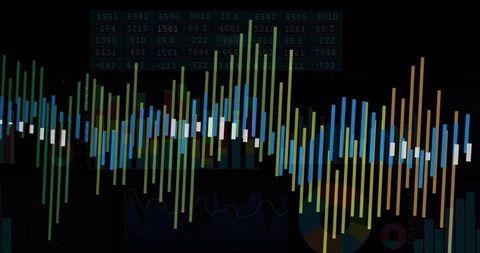
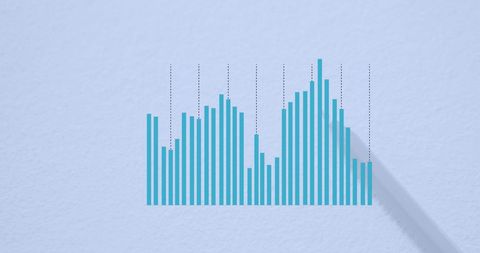
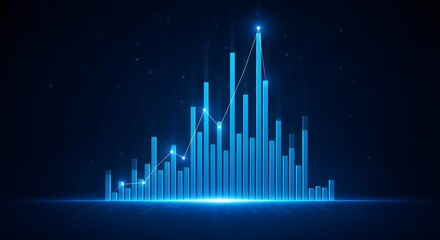
- Colorful Bar Graph Representing Financial Data Trends
Colorful Bar Graph Representing Financial Data Trends Image

Colorful bar graph represents financial data trends in a visually appealing manner. Useful for presentations, reports, or as a digital element in articles related to economics, business analysis, data interpretation, financial predictions, and market research. Perfect for incorporating into educational materials or business corporate media to simplify complex data.
Powered by 


2
downloads
downloads
Tags:
More
Credit Photo
If you would like to credit the Photo, here are some ways you can do so
Text Link
photo Link
<span class="text-link">
<span>
<a target="_blank" href=https://pikwizard.com/photo/colorful-bar-graph-representing-financial-data-trends/ba24d8ebf166e3d31617dd87013a1351/>PikWizard</a>
</span>
</span>
<span class="image-link">
<span
style="margin: 0 0 20px 0; display: inline-block; vertical-align: middle; width: 100%;"
>
<a
target="_blank"
href="https://pikwizard.com/photo/colorful-bar-graph-representing-financial-data-trends/ba24d8ebf166e3d31617dd87013a1351/"
style="text-decoration: none; font-size: 10px; margin: 0;"
>
<img src="https://pikwizard.com/pw/medium/ba24d8ebf166e3d31617dd87013a1351.jpg" style="margin: 0; width: 100%;" alt="" />
<p style="font-size: 12px; margin: 0;">PikWizard</p>
</a>
</span>
</span>
Free (free of charge)
Free for personal and commercial use.
Author: Awesome Content
Similar Free Stock Images

Premium


Premium


Premium


Premium


Premium


Premium


Premium


Premium


Premium


Premium


Premium


Premium


Premium


Premium


Premium


Premium


Premium


Premium


Premium


Premium


Premium


Premium


Premium


Premium


Premium