
- Home >
- Stock Photos >
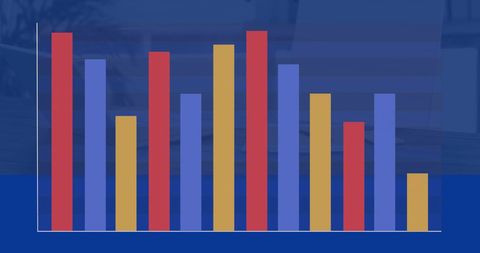
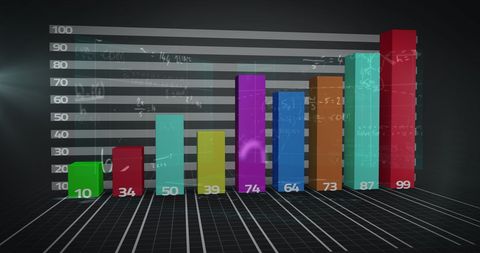
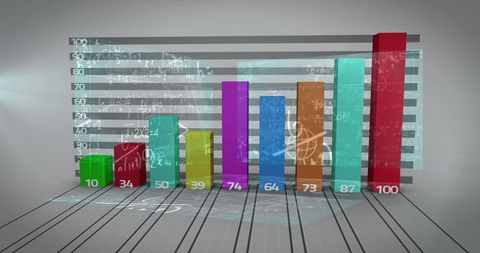
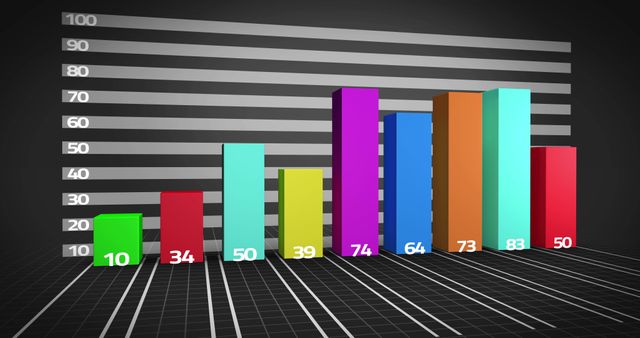
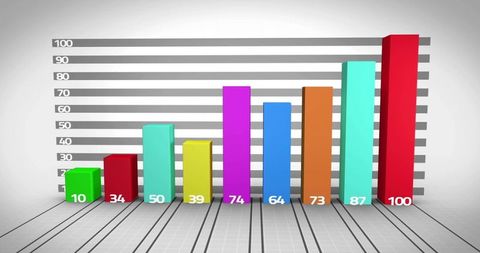
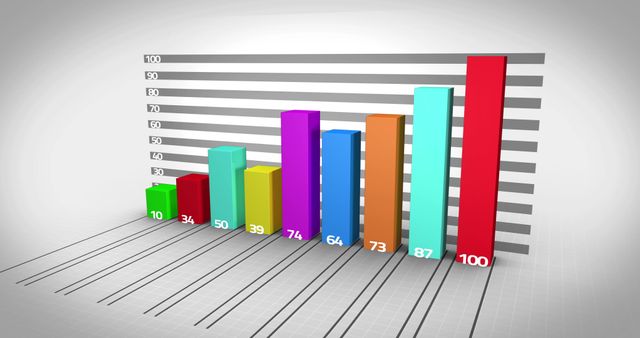
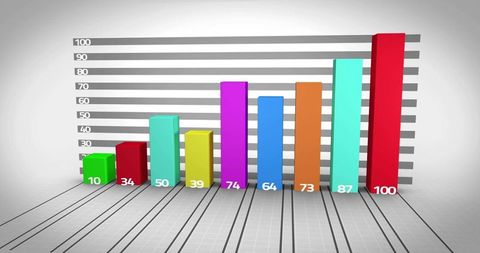
- Colorful Bar Graph Visualizing Data Trends on Grid Background
Colorful Bar Graph Visualizing Data Trends on Grid Background Image
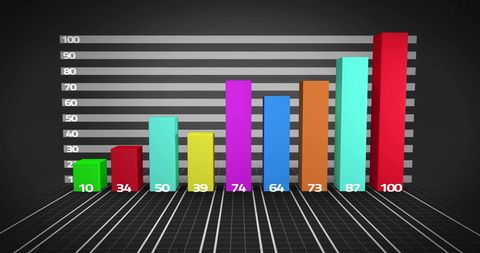
Colorful bar graph illustrates varying data points against a grid background. With each bar uniquely colored, this visual can represent statistical information effectively. Suitable for presentations, reports, educational materials, and infographics focusing on data trends and analysis.
Powered by 


downloads
Tags:
More
Credit Photo
If you would like to credit the Photo, here are some ways you can do so
Text Link
photo Link
<span class="text-link">
<span>
<a target="_blank" href=https://pikwizard.com/photo/colorful-bar-graph-visualizing-data-trends-on-grid-background/cfba9a3f0a7e30952da0c62e442954b4/>PikWizard</a>
</span>
</span>
<span class="image-link">
<span
style="margin: 0 0 20px 0; display: inline-block; vertical-align: middle; width: 100%;"
>
<a
target="_blank"
href="https://pikwizard.com/photo/colorful-bar-graph-visualizing-data-trends-on-grid-background/cfba9a3f0a7e30952da0c62e442954b4/"
style="text-decoration: none; font-size: 10px; margin: 0;"
>
<img src="https://pikwizard.com/pw/medium/cfba9a3f0a7e30952da0c62e442954b4.jpg" style="margin: 0; width: 100%;" alt="" />
<p style="font-size: 12px; margin: 0;">PikWizard</p>
</a>
</span>
</span>
Free (free of charge)
Free for personal and commercial use.
Author: Authentic Images
Similar Free Stock Images

Premium

Premium


Premium


Premium

Premium


Premium


Premium


AI

Premium


Premium


Premium


Premium


Premium


Premium


Premium


AI


Premium


Premium


Premium


Premium


Premium


AI


Premium


AI


Premium


Premium

AI


Premium

AI

Premium


Premium
Explore More Free Stock Images