
- Home >
- Stock Photos >
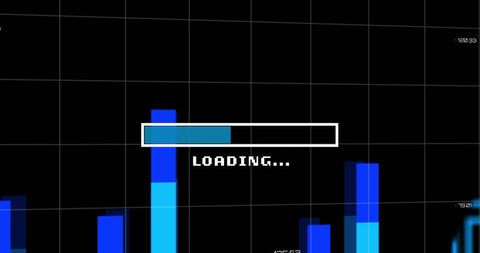
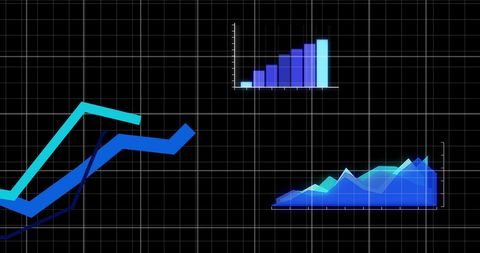
- Colorful Bar Graph with Annotated Progress Data
Colorful Bar Graph with Annotated Progress Data Image

This visualization features a multi-colored bar and area graph illustrating data segments labeled 'first' through 'fifth', emphasizing a highlighted value with an annotation. Perfect for presentations and reports highlighting progress and distribution in various datasets, offering a visually engaging way to convey statistics and business performance.
Powered by  - Get 15% off with code: PIKWIZARD15


downloads
Tags:
More
Credit Photo
If you would like to credit the Photo, here are some ways you can do so
Text Link
photo Link
<span class="text-link">
<span>
<a target="_blank" href=https://pikwizard.com/photo/colorful-bar-graph-with-annotated-progress-data/fa4b8fada45f407432e4bbbe3e427ddd/>PikWizard</a>
</span>
</span>
<span class="image-link">
<span
style="margin: 0 0 20px 0; display: inline-block; vertical-align: middle; width: 100%;"
>
<a
target="_blank"
href="https://pikwizard.com/photo/colorful-bar-graph-with-annotated-progress-data/fa4b8fada45f407432e4bbbe3e427ddd/"
style="text-decoration: none; font-size: 10px; margin: 0;"
>
<img src="https://pikwizard.com/pw/medium/fa4b8fada45f407432e4bbbe3e427ddd.jpg" style="margin: 0; width: 100%;" alt="" />
<p style="font-size: 12px; margin: 0;">PikWizard</p>
</a>
</span>
</span>
Free (free of charge)
Free for personal and commercial use.
Author: Authentic Images
Similar Free Stock Images

Premium


Premium

Premium

Premium


Premium

Premium


Premium

Premium

Premium


Premium

Premium


Premium


Premium


Premium

Premium

Premium


Premium

Premium

Premium


Premium


Premium


Premium


Premium

Premium


Premium

Explore More Free Stock Images