1. Home > 
  2. Stock Photos > 
  3. Colorful Bar Graphs Data Visualization on White Background

Colorful Bar Graphs Data Visualization on White Background Image

Colorful Bar Graphs Data Visualization on White Background

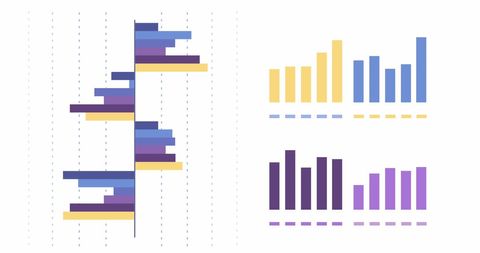
Stock imagery of colorful bar graphs ideal for illustrating concepts related to business analytics and financial data processing. Useful for presentations, reports, or educational materials that explain data-driven strategies or financial analysis. The variety and arrangement of graphs can depict diverse analytics approaches and make complex data easy to understand.

Powered by Shutterstock logo - Get 15% off with code: PIKWIZARD15
Displaying bar and line graph on trading interface, with translucent green bars and red trend line. Financial, analytics, data visualization, technology, investment, digital, business - Powered by Shutterstock - Get 15% off with code: PIKWIZARD15Displaying digital chart on trading desk, with candlestick bars, trend lines and numeric data. Finance, technology, analytics, data visualization, investment, stock market, dashboard - Powered by Shutterstock - Get 15% off with code: PIKWIZARD15Displaying 3D bar chart rising on wireframe grid in virtual dashboard, with green red data columns. Financial, analytics, futuristic, data visualization, digital, technology, business - Powered by Shutterstock - Get 15% off with code: PIKWIZARD15Showing line graph 2008–2015 on dashboard with bar charts and histograms, gridlines and labels. Data visualization, analytics, digital interface, financial analysis, business intelligence, - Powered by Shutterstock - Get 15% off with code: PIKWIZARD15Displaying colorful bar chart on finance screen over city with scrolling tickers and numeric axes. Analytics, data visualization, modern, technology, finance, urban, digital - Powered by Shutterstock - Get 15% off with code: PIKWIZARD15

Credit Photo

If you would like to credit the Photo, here are some ways you can do so

Free (free of charge)

Free for personal and commercial use.

Author: Authentic Images

Similar Free Stock Images

Financial Data Processing Over Digital Interface and Graphs
Premium
Displaying trading dashboard overlaying blurred city lights, with bar charts line graphs and tables. Technology, analytics, data visualization, finance, digital, urban, abstract
Colorful Abstract Bar Chart Representing Statistical Data
Premium
Displaying dashboard presenting metrics in office space with bar charts, line graphs and data grid. Technology, data, analytics, business, innovation, visualization, modern
Premium
Dashboard showing bar charts and line graph in digital interface, numeric labels and gauge charts. Data visualization, analytics, dashboard, metrics, digital interface, finance, technology
Abstract Digital QR Code with Color Elements Highlighting Technology
Digital Data Processing and Analysis Visualizations
Colorful Retro Digital Equalizer Neon Background
Dynamic Stock Market Analysis with Multicolored Statistics
LGBTQ History Month Celebration with Rainbow Background
Digital Financial Data Visualizations on Black Background
Digital Graph Interface Illustrating Financial Data Analysis
Financial Graphs and World Map Illustrating Market Data
Premium
Displaying market chart on trading interface, with bars, candlesticks, line graphs and grid overlay. Financial, data, analytics, digital, modern, technology, investment
Digital Data Processing Dashboard in Global Connection Visualization
Colorful Financial Graphs and Analytics on Black Background
Colorful Bar Chart Display Against Dark Background
Premium
Animating market mesh on interface, candlestick, line and bar charts and gauges, numeric labels. Finance, data, technology, analytics, digital, network, visualization
Colorful Data Analytics and Statistics Conceptual Graphics
Financial Data Processing with Charts and Graphics on Digital Blue Background
Economic Crisis Concept with Blue Line Graph Background
Financial Data Charts & Analysis on Dark Screen
Premium
Overlaying candlestick and histogram bars with line graphs, markers and labels on trading dashboard. Financial, technology, analytics, data visualization, finance, investment, digital interface
Financial Data Processing Visualization on Dark Background
Finance and Technology Concept with Holographic Graphs
Vibrant Digital Rainbow Stripes Celebrating LGBTQ Pride
Traditional Red Chinese Corner Pattern on Yellow Background
Premium
Showing 3D bar chart columns emerging on holographic grid, with line graphs and numeric labels. Futuristic, data, analytics, holographic, visualization, digital, market
Abstract Vibrant Squares with White Background
Data Processing Graph with Digital Interface Elements
Digital Data and Arrows Showcasing Market Trends
Financial Data Analysis on Transparent Grid Background
Colorful Graph with Arrow Showing Business Growth Trend
Digital Data Visualization with Graph Charts on Dark Background
Colorful Stacked Bar Chart with Data Analysis Elements
Futuristic Data Visualization with Graphs and Charts
Analyzing Digital Graphs Highlighting Financial Data Trends
Premium
Displaying financial chart at digital interface, with blue bars, two line graphs, red decline arrow. Finance, data, analytics, dashboard, technology, investment, digital
Premium
Displaying trading dashboard on screen with line graphs, bar charts, numeric data and lens flare. Technology, analytics, innovation, finance, data visualization, futuristic, digital
Premium
Displaying financial data on dark grid UI, showing bar charts, candlesticks, line graphs and gauges. Analytics, data visualization, digital interface, financial technology, futurism, dashboard,
Premium
Displaying teal dotted bars on left with blue pink line graphs, network mesh with medical icons. Analytics, data visualization, digital interface, healthtech, financial chart, network diagram,
Digital Projection of Financial Data with Bar Graphs
Vibrant Rainbow Square Grid Pattern
Dynamic Financial Data Analytics Display with Graphs
Abstract QR Code with Colorful Data Squares
Premium
Translucent charts covering grid in boardroom, with candlestick, bar graphs and numeric labels. Financial, data, analytics, technology, business, modern, digital
Statistical Data Visualization Against Blue Background
Global Business Analytics and Growth Concept Hologram
Stylized Graphs and Charts on White Background for Data Analysis Concepts
Premium
Financial chart displaying cyan bars, red line in blue dashboard, with ticker symbols, grid lines. Technology, analytics, finance, data visualization, dashboard, investment, digital
Abstract Digital Interface With QR Code Elements
Abstract Digital Graphs Depicting Financial Statistics Analysis
Digital Bar and Line Chart with Financial Growth Analysis
Composite Business Charts with Cafes Interior
Premium
A professional presenting data visualizations with bar charts and pie charts, signifying analytics or financial performance.
Premium
Displaying digital financial bar chart overlay in cooled data center corridor, showing server racks. Technology, data, analytics, finance, innovation, infrastructure, digital
Graph and Chart Display on White Grid Background
Abstract Finance Chart with Rising Bars and Data Analysis
LGBTQ History Month Concept Text in Bold Rainbow Colors
Abstract Data Visualization on Red Background
Premium
Displaying financial chart on trading interface, showing bar charts, line graphs, gridlines. Finance, analytics, data, technology, dashboard, visualization, investment
Abstract Financial Data Charts and Graphs on Black Background
Dynamic Digital Data Visualization with Graphs and Statistics
Digital Bar Graph on Dark Global Business Interface
Premium
Displaying trading dashboard on screen showing candlesticks bar and line graphs, numeric indicators. Finance, stockmarket, analytics, data visualization, technology, investment, digital interface
Financial Data Analysis Graph on Blue Background Concept
Global Data Analysis with Mathematical Visualization
Dynamic Digital Data Processing and Analysis Graphs
Financial Growth Bar and Line Graph on Digital Background
Dynamic Financial Data Analysis with Virtual Screen
Rainbow Stripe Heart Illustrating Diversity and Pride
Digital Growth Metrics with Dynamic Data Visualization
Colorful Abstract Graphs and Charts for Data Analysis and Presentation
Digital Financial Data Analysis with Graphs and Charts on Black Background
Abstract Graphic Business Data Visualization
Retro Graphic Design with Colorful Column Bars
Futuristic Financial Data Analysis Interface Concept
Digital Bar Graphs Display Finance Data Online
Premium
Financial chart and investment graph analysis stock on tablet screen. Data dashboard and report insight for finance growth, stock market, and business performance strategy.
Digital Bar Chart Display on Dark Grid Background
Digital Data Dashboard with Transparent Financial Graphs
Premium
Floating bar and line charts above tablet at office desk, with stylus smartphone ¥$€£ symbols. Technology, data analytics, finance, innovation, collaboration, digital, business
Digital Interface Displaying Global Finance Data Charts
Vibrant Geometric Pattern in Dynamic Blue Tones
Retro Futuristic Moving Blue Shapes on Black Background
Graphical Analysis on Russian Economy with Financial Metrics
Abstract Blue and Violet Stripes Minimalist Background
Digital Data Analytics Dashboard with Interactive Graphs and Charts
Innovative Data Visualizations with Graphs and Charts
Digital Interface with Stock Market Graphs and Statistics
Premium
Presenting trading interface with bar chart, line graph, arrow and red green ticker, copy space. Finance, data visualization, analytics, digital, technology, investment, business
Digital Data Analysis with Futuristic Charts
Colorful Social Media Icons Floating on Black Background
Global Data Processing with Abstract Graph and Network
Multicolor TV Color Bars Signal Interference Concept
Colorful Bar Chart Data Visualization on Gradient Blue Background
Innovative Financial Data Interface Illustration Over Blue Background
Digital Financial Data Charts on Blue Background
Abstract Business Data and Growth Analysis in Holographic Style
Digital Data Processing with Bar and Line Graphs
Abstract Graphical Data Representation in Blue Tones
Dynamic Financial Data Display in Digital Interface Over Black Background
Digital Financial Data Analysis on Futuristic Blue Interface
Neon Blue Financial Bar Graph on Digital Grid Background
Premium
Displaying bar chart on financial dashboard screen, with overlaid line graphs and percentage labels. Finance, analytics, data visualization, dashboard, investment, market trends, business intelligence
Premium
Business executive wearing suit analyzing financial data on laptop in office with chart overlays. Technology, finance, analytics, corporate, digital, data visualization, professional
Digital Data Processing Display on Blue Background
Data Analysis Charts and Graphs on Digital Interface
Digital Global Analytics Interface with Infographics and Data Visualization
Global Financial Data Analysis Concept with Charts
Financial Data Graphs Show Income and Tax Trends
LGBTQ History Month Concept with Vibrant Rainbow Background
6G Technology Concept with Digital Data Processing Display
Global Financial Data Analysis on digital map backdrop exploring trends and insights
Premium
Displaying digital interface overlaying corporate corridor, with line graph, tickers and dashboards. Technology, analytics, innovation, business, data visualization, finance, modern
Financial Data Processing Bar Graph on Minimalist Background
Cyber Monday Sale Banner with Bold Typography
Colorful Bar Graph Representing Financial Data Trends
Colorful Bar Chart Displayed Over Blue Background
Premium
Showing transparent colorful bars and line graphs floating in car cabin, with smartphone seatbelt. Data visualization, financial analysis, digital metrics, business technology, modern design,
Social Media Interaction Graph on Digital Network
Dynamic Data Visualization Depicting Financial Growth Trends
Colorful Bar Graphs Showing Data Analysis Trends
Orange QR Code for Digital Scanning on White Background
Premium
Displaying transparent financial dashboard on city plaza window, with teal bars and numeric labels. Technology, data visualization, finance, modern design, business, professional, urban
Explore More Free Stock Images