
- Home >
- Stock Photos >
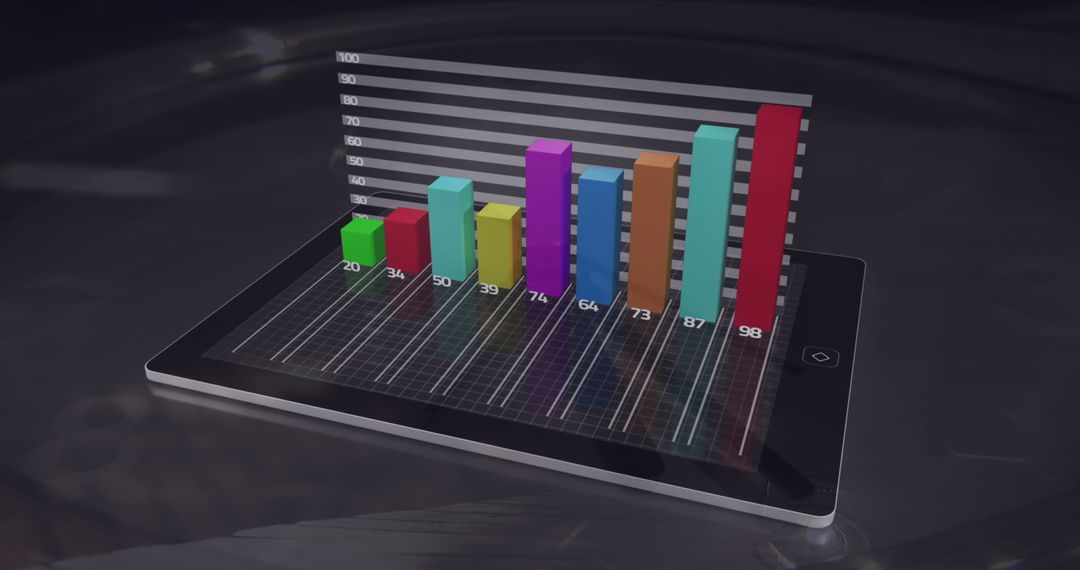
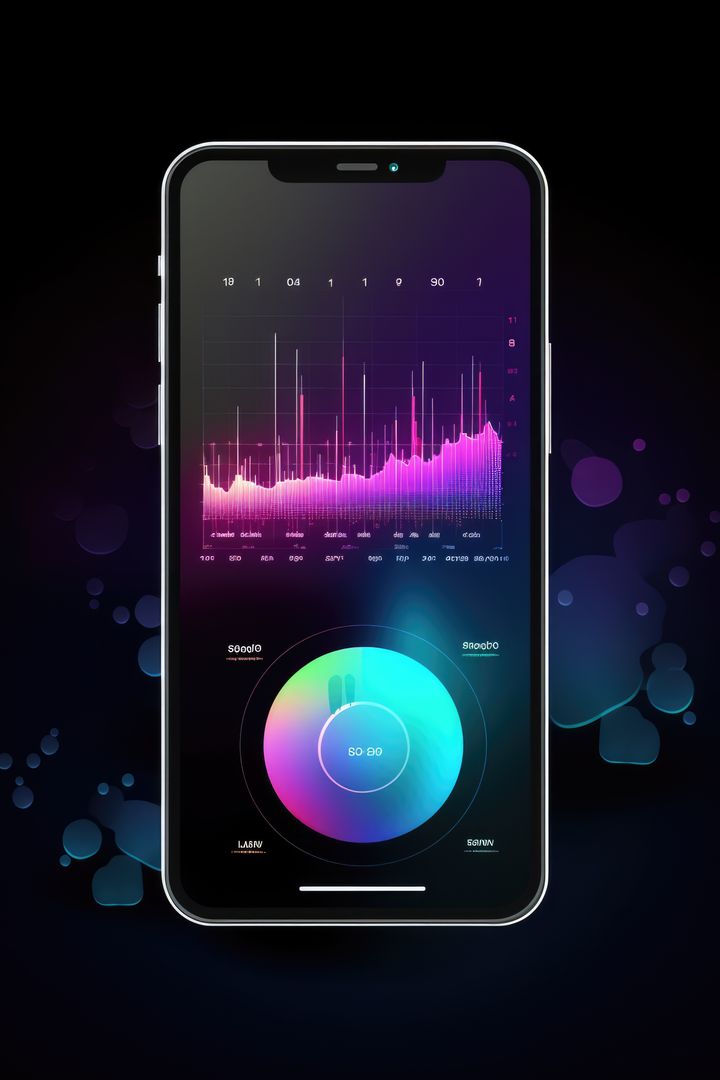
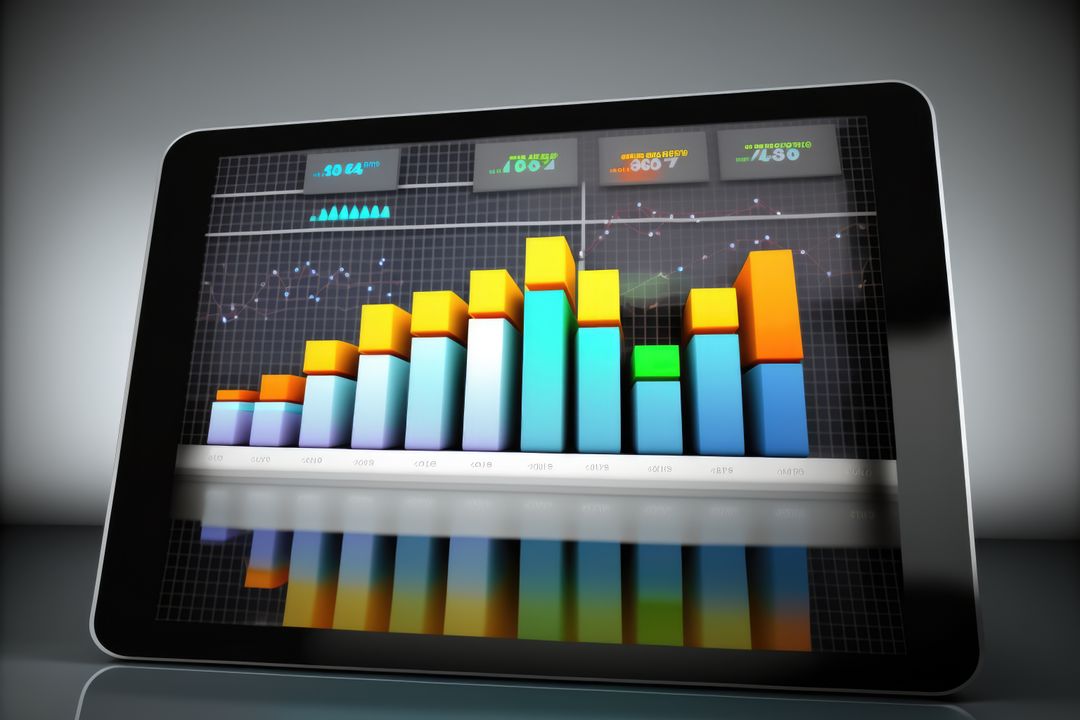
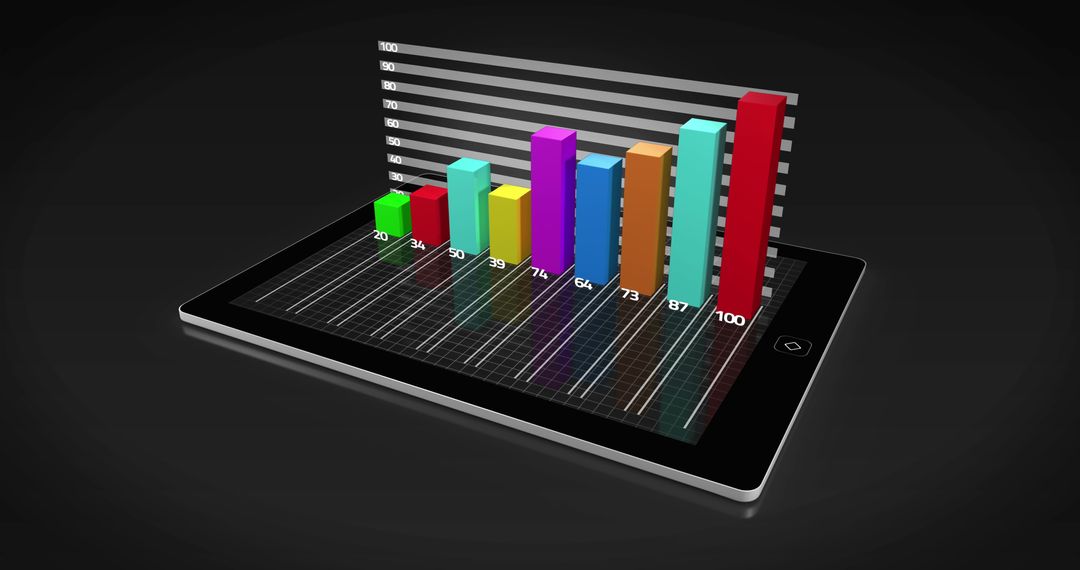
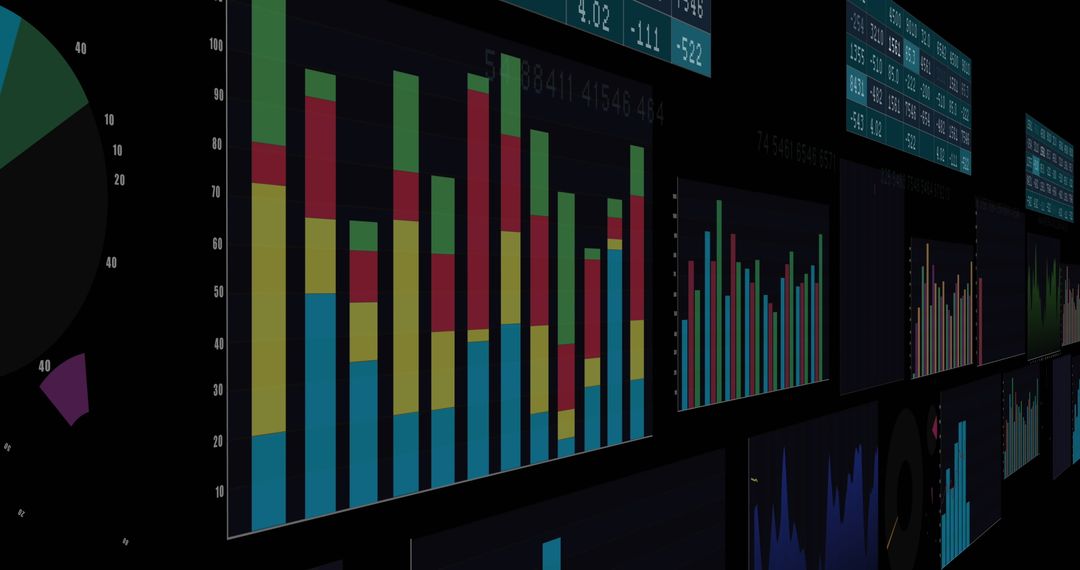
- Colorful Bar Graphs on Tablet Display with Dark Background
Colorful Bar Graphs on Tablet Display with Dark Background Image

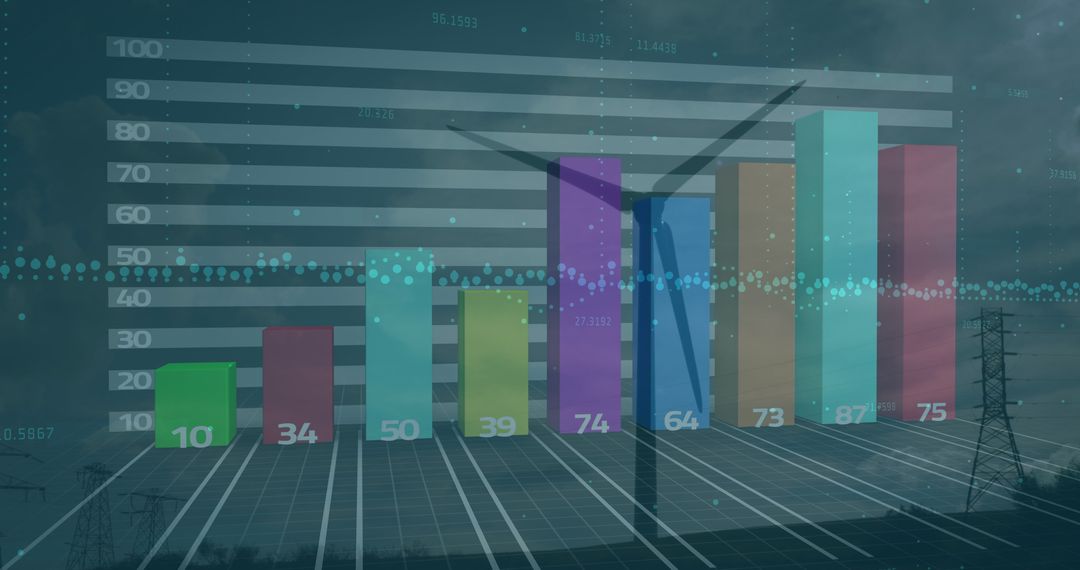
AI Generated Image. Colorful bar graphs are displayed on a tablet screen against a dark background. Ideal for illustrating topics related to data analysis, presentations, business financial reports, or technology-focused articles. Suitable for websites, blogs, or educational presentations that need to convey concepts in data visualization and digital information interactions.
Powered by  - Get 15% off with code: PIKWIZARD15


0
downloads
downloads
Tags:
More
Credit Photo
If you would like to credit the Photo, here are some ways you can do so
Text Link
photo Link
<span class="text-link">
<span>
<a target="_blank" href=https://pikwizard.com/photo/colorful-bar-graphs-on-tablet-display-with-dark-background/03b87007d7cca387bdce07bfbdc122e6/>PikWizard</a>
</span>
</span>
<span class="image-link">
<span
style="margin: 0 0 20px 0; display: inline-block; vertical-align: middle; width: 100%;"
>
<a
target="_blank"
href="https://pikwizard.com/photo/colorful-bar-graphs-on-tablet-display-with-dark-background/03b87007d7cca387bdce07bfbdc122e6/"
style="text-decoration: none; font-size: 10px; margin: 0;"
>
<img src="https://pikwizard.com/pw/medium/03b87007d7cca387bdce07bfbdc122e6.jpg" style="margin: 0; width: 100%;" alt="" />
<p style="font-size: 12px; margin: 0;">PikWizard</p>
</a>
</span>
</span>
Free (free of charge)
Free for personal and commercial use.
Author: AI Creator
Similar Free Stock Images

Premium


Premium


Premium


Premium


Premium


Premium


Premium


Premium


Premium


Premium


Premium


Premium


Premium


Premium


Premium


Premium


Premium


Premium


Premium


Premium


Premium


Premium


Premium


Premium

