- Home >
- Stock Photos >
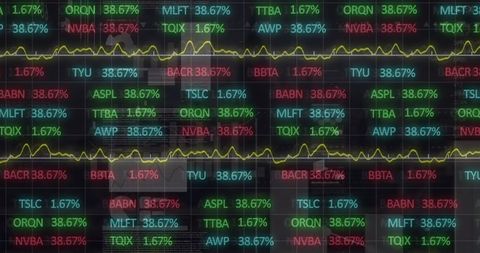
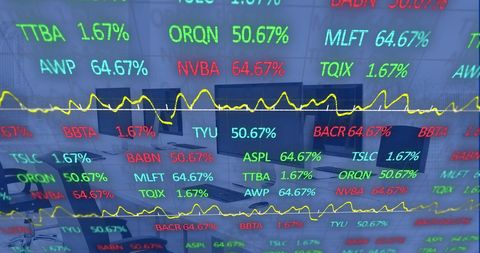
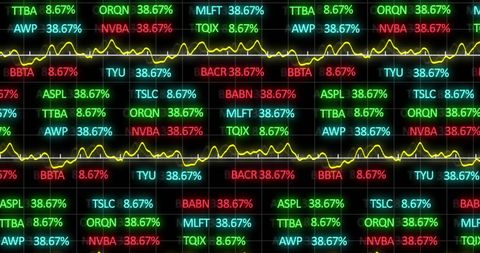
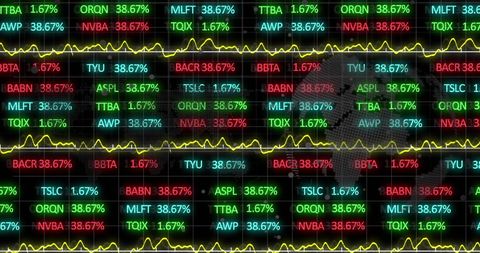
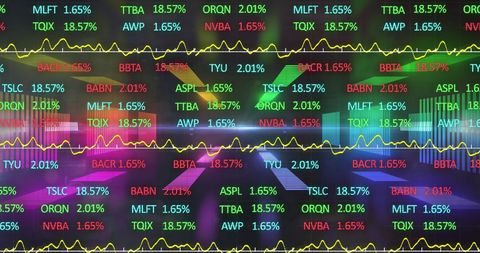
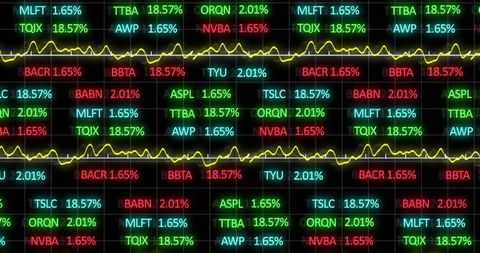
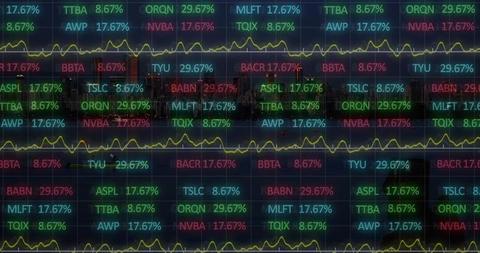
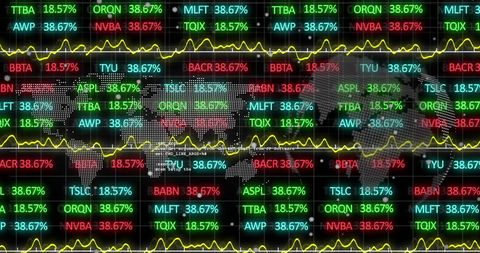
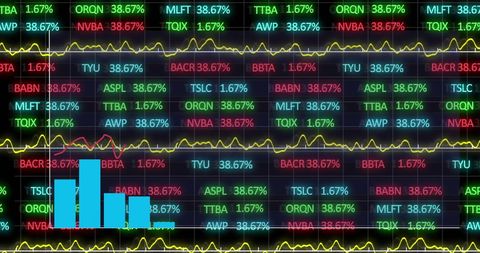
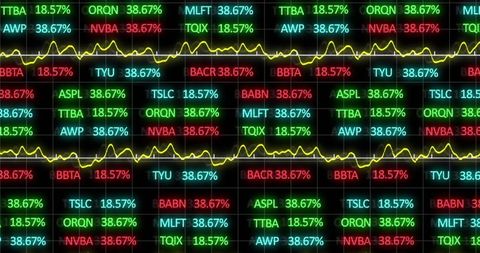
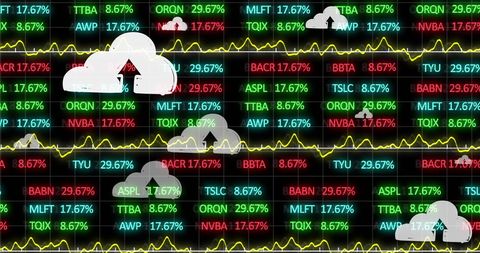
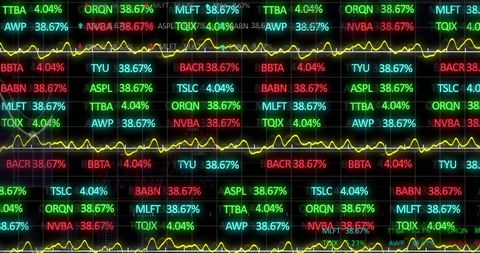
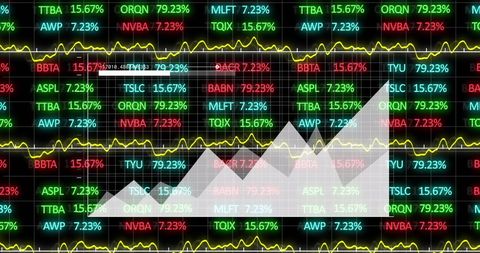
- Colorful Bar Graphs Overlay Stock Market Ticker Display
Colorful Bar Graphs Overlay Stock Market Ticker Display Image

Digital concept of financial data analysis with colorful bar graphs overlaying a stock market ticker. Suitable for illustrating economic trends, investment strategies, financial reports, trading guides, and educational content about market analysis tools.
Powered by  - Get 15% off with code: PIKWIZARD15


10
downloads
downloads
Tags:
More
Credit Photo
If you would like to credit the Photo, here are some ways you can do so
Text Link
photo Link
<span class="text-link">
<span>
<a target="_blank" href=https://pikwizard.com/photo/colorful-bar-graphs-overlay-stock-market-ticker-display/908f06f61449050fb27812b1dfe2b3da/>PikWizard</a>
</span>
</span>
<span class="image-link">
<span
style="margin: 0 0 20px 0; display: inline-block; vertical-align: middle; width: 100%;"
>
<a
target="_blank"
href="https://pikwizard.com/photo/colorful-bar-graphs-overlay-stock-market-ticker-display/908f06f61449050fb27812b1dfe2b3da/"
style="text-decoration: none; font-size: 10px; margin: 0;"
>
<img src="https://pikwizard.com/pw/medium/908f06f61449050fb27812b1dfe2b3da.jpg" style="margin: 0; width: 100%;" alt="" />
<p style="font-size: 12px; margin: 0;">PikWizard</p>
</a>
</span>
</span>
Free (free of charge)
Free for personal and commercial use.
Author: Authentic Images
Similar Free Stock Images

Premium


Premium


Premium


Premium


Premium


Premium


Premium


Premium


Premium


Premium


Premium


Premium


Premium


Premium


Premium


Premium


Premium


Premium


Premium


Premium


Premium


Premium


Premium


Premium


Premium