- Home >
- Stock Photos >
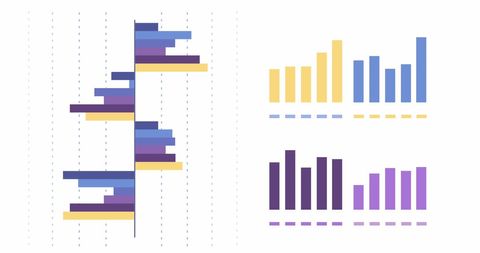
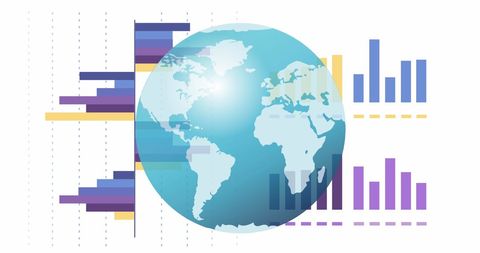
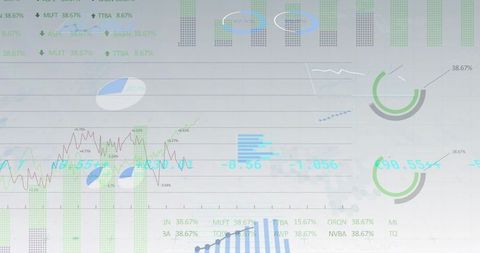
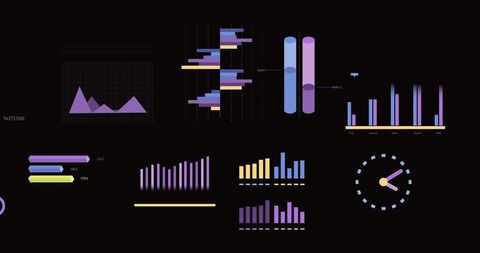
- Colorful Bar Graphs Showing Data Analysis Trends
Colorful Bar Graphs Showing Data Analysis Trends Image
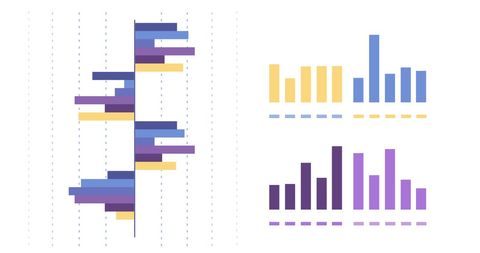
Colorful bar graphs illustrate data and trend analysis, perfect for presentations, reports, and educational materials in the business and financial sectors. The visual appeal of colorful graphs helps communicate complex data in a clear and engaging way, making it suitable for digital and print use. Ideal for conveying data analysis results, business performance updates, or academic research findings.

downloads
Tags:
More
Credit Photo
If you would like to credit the Photo, here are some ways you can do so
Text Link
photo Link
<span class="text-link">
<span>
<a target="_blank" href=https://pikwizard.com/photo/colorful-bar-graphs-showing-data-analysis-trends/ecca38f52f06f19d979a88e4100e2a0e/>PikWizard</a>
</span>
</span>
<span class="image-link">
<span
style="margin: 0 0 20px 0; display: inline-block; vertical-align: middle; width: 100%;"
>
<a
target="_blank"
href="https://pikwizard.com/photo/colorful-bar-graphs-showing-data-analysis-trends/ecca38f52f06f19d979a88e4100e2a0e/"
style="text-decoration: none; font-size: 10px; margin: 0;"
>
<img src="https://pikwizard.com/pw/medium/ecca38f52f06f19d979a88e4100e2a0e.jpg" style="margin: 0; width: 100%;" alt="" />
<p style="font-size: 12px; margin: 0;">PikWizard</p>
</a>
</span>
</span>
Free (free of charge)
Free for personal and commercial use.
Author: Authentic Images