
- Home >
- Stock Photos >
- Colorful Candlestick and Line Chart with Data Dashboard Elements
Colorful Candlestick and Line Chart with Data Dashboard Elements Image
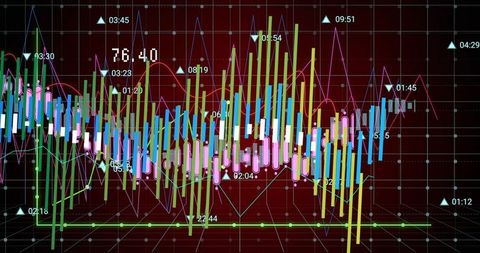
This image shows a dynamic representation of a candlestick and line chart, featuring various data elements, including colorful bars, data markers, and trend lines on a digital financial dashboard. Useful for presentations on financial analysis, stock market performance, digital finance technologies or stock trading insights.
Powered by 


downloads
Tags:
More
Credit Photo
If you would like to credit the Photo, here are some ways you can do so
Text Link
photo Link
<span class="text-link">
<span>
<a target="_blank" href=https://pikwizard.com/photo/colorful-candlestick-and-line-chart-with-data-dashboard-elements/295c2b2c831d48d8ba47f65c5bc6c2c8/>PikWizard</a>
</span>
</span>
<span class="image-link">
<span
style="margin: 0 0 20px 0; display: inline-block; vertical-align: middle; width: 100%;"
>
<a
target="_blank"
href="https://pikwizard.com/photo/colorful-candlestick-and-line-chart-with-data-dashboard-elements/295c2b2c831d48d8ba47f65c5bc6c2c8/"
style="text-decoration: none; font-size: 10px; margin: 0;"
>
<img src="https://pikwizard.com/pw/medium/295c2b2c831d48d8ba47f65c5bc6c2c8.jpg" style="margin: 0; width: 100%;" alt="" />
<p style="font-size: 12px; margin: 0;">PikWizard</p>
</a>
</span>
</span>
Free (free of charge)
Free for personal and commercial use.
Author: Awesome Content