- Home >
- Stock Photos >
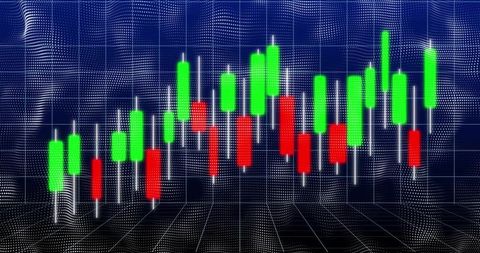
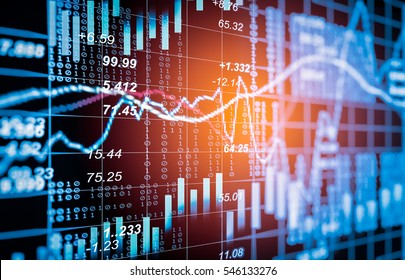
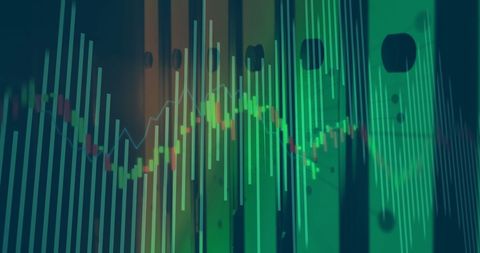
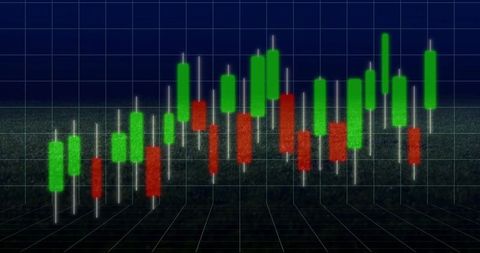
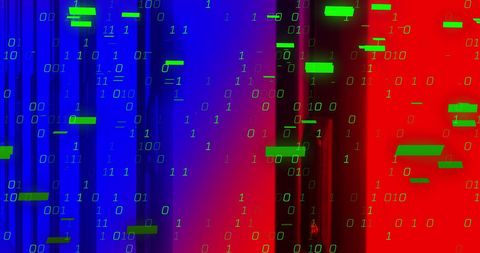
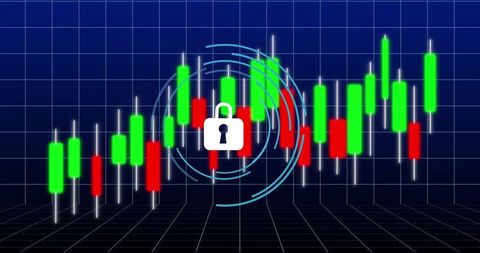
- Colorful Candlestick Chart on Digital Financial Interface
Colorful Candlestick Chart on Digital Financial Interface Image

Candlestick chart appears against a backdrop of digital binary code and financial graphics. This conveys data analysis, stock market trading, blockchain technology, and economic research. Use in presentations or articles about finance, investments, and market trends.
Powered by  - Get 15% off with code: PIKWIZARD15


2
downloads
downloads
Tags:
More
Credit Photo
If you would like to credit the Photo, here are some ways you can do so
Text Link
photo Link
<span class="text-link">
<span>
<a target="_blank" href=https://pikwizard.com/photo/colorful-candlestick-chart-on-digital-financial-interface/bd31446deb0c50c201d0243a5094fb99/>PikWizard</a>
</span>
</span>
<span class="image-link">
<span
style="margin: 0 0 20px 0; display: inline-block; vertical-align: middle; width: 100%;"
>
<a
target="_blank"
href="https://pikwizard.com/photo/colorful-candlestick-chart-on-digital-financial-interface/bd31446deb0c50c201d0243a5094fb99/"
style="text-decoration: none; font-size: 10px; margin: 0;"
>
<img src="https://pikwizard.com/pw/medium/bd31446deb0c50c201d0243a5094fb99.jpg" style="margin: 0; width: 100%;" alt="" />
<p style="font-size: 12px; margin: 0;">PikWizard</p>
</a>
</span>
</span>
Free (free of charge)
Free for personal and commercial use.
Author: Awesome Content
Similar Free Stock Images
Loading...

Premium


Premium

Premium


Premium


Premium

Premium


Premium


Premium
Premium

Premium


Premium

Premium


Premium


Premium


Premium


Premium

Premium


Premium


Premium


Premium


Premium

Premium

Premium

Premium


Premium