
- Home >
- Stock Photos >
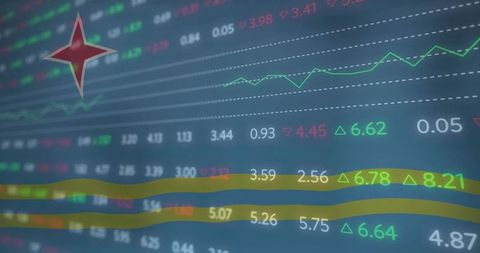
- Colorful Changing Data Graph with Numeric Markers on Technology Background
Colorful Changing Data Graph with Numeric Markers on Technology Background Image

This vibrant graphic illustrates a multi-colored line graph fluctuating amidst digital numeric markings. It symbolizes data visualization and analytics in a technology-driven environment. The shifting lines and numbers convey the steady flow and volatility in financial data and investment strategies. Ideal for use in finance-related presentations, technology company websites, or as a backdrop for corporate training materials that emphasize innovation and data analytics.
Powered by 


downloads
Tags:
More
Credit Photo
If you would like to credit the Photo, here are some ways you can do so
Text Link
photo Link
<span class="text-link">
<span>
<a target="_blank" href=https://pikwizard.com/photo/colorful-changing-data-graph-with-numeric-markers-on-technology-background/9fa792299c54e710491afdc2f5fb7a52/>PikWizard</a>
</span>
</span>
<span class="image-link">
<span
style="margin: 0 0 20px 0; display: inline-block; vertical-align: middle; width: 100%;"
>
<a
target="_blank"
href="https://pikwizard.com/photo/colorful-changing-data-graph-with-numeric-markers-on-technology-background/9fa792299c54e710491afdc2f5fb7a52/"
style="text-decoration: none; font-size: 10px; margin: 0;"
>
<img src="https://pikwizard.com/pw/medium/9fa792299c54e710491afdc2f5fb7a52.jpg" style="margin: 0; width: 100%;" alt="" />
<p style="font-size: 12px; margin: 0;">PikWizard</p>
</a>
</span>
</span>
Free (free of charge)
Free for personal and commercial use.
Author: Awesome Content
Similar Free Stock Images

Premium


Premium


Premium

Premium

Premium


Premium


Premium


Premium


Premium


Premium


Premium

Premium


Premium

Premium


Premium

Premium


Premium


Premium


Premium

Premium

Premium


Premium


Premium


Premium


Premium
Explore More Free Stock Images