- Home >
- Stock Photos >
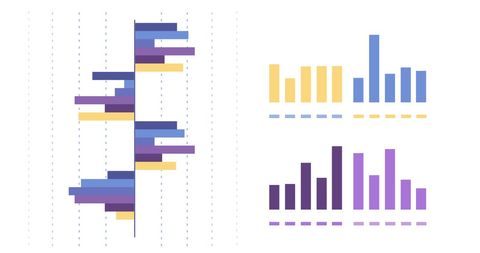
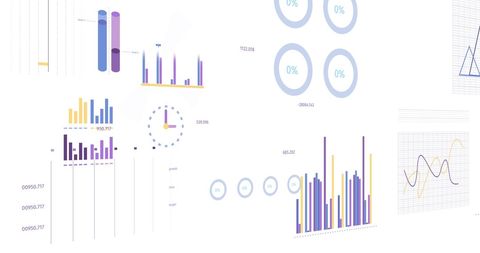
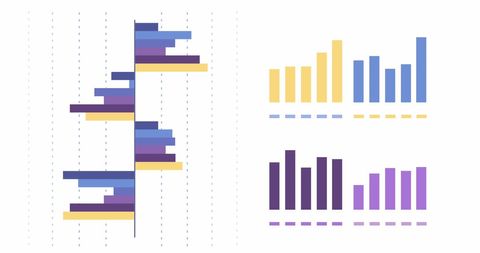
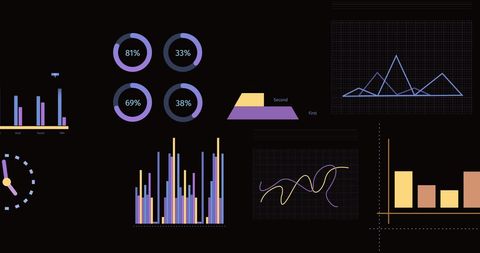
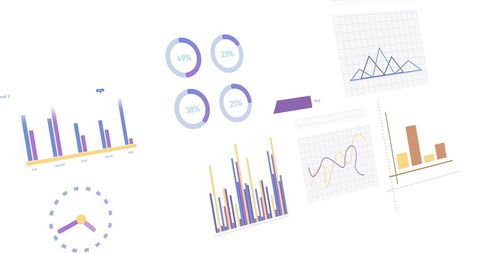
- Colorful Data Analytics and Statistics Conceptual Graphics
Colorful Data Analytics and Statistics Conceptual Graphics Image

This image presents various conceptual graphs and charts displaying statistical and financial data in vibrant colors on a white background, highlighting trends and information technology use. It is ideal for illustrating topics related to business analytics, data processing, and statistics in presentations, reports, and websites.

downloads
Tags:
More
Credit Photo
If you would like to credit the Photo, here are some ways you can do so
Text Link
photo Link
<span class="text-link">
<span>
<a target="_blank" href=https://pikwizard.com/photo/colorful-data-analytics-and-statistics-conceptual-graphics/81b47303fff57f1daec6fee45235dc06/>PikWizard</a>
</span>
</span>
<span class="image-link">
<span
style="margin: 0 0 20px 0; display: inline-block; vertical-align: middle; width: 100%;"
>
<a
target="_blank"
href="https://pikwizard.com/photo/colorful-data-analytics-and-statistics-conceptual-graphics/81b47303fff57f1daec6fee45235dc06/"
style="text-decoration: none; font-size: 10px; margin: 0;"
>
<img src="https://pikwizard.com/pw/medium/81b47303fff57f1daec6fee45235dc06.jpg" style="margin: 0; width: 100%;" alt="" />
<p style="font-size: 12px; margin: 0;">PikWizard</p>
</a>
</span>
</span>
Free (free of charge)
Free for personal and commercial use.
Author: Awesome Content