
- Home >
- Stock Photos >
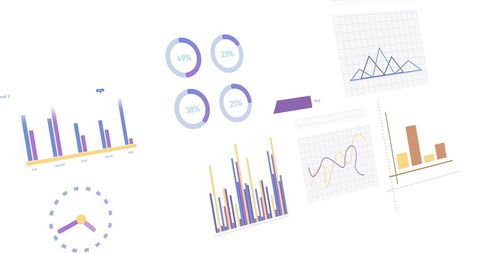
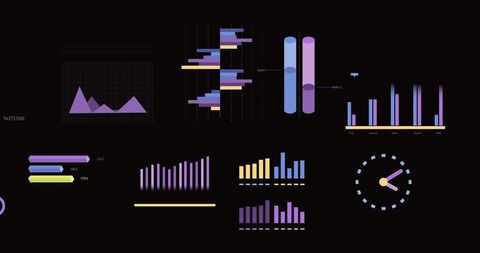
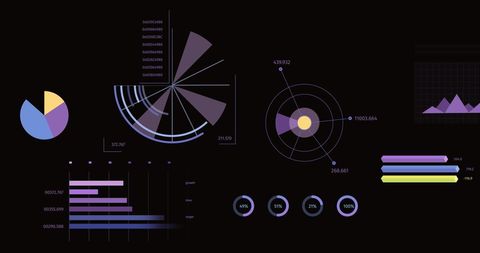
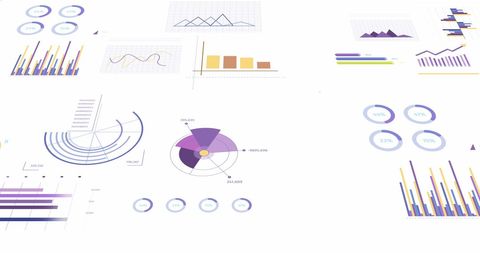
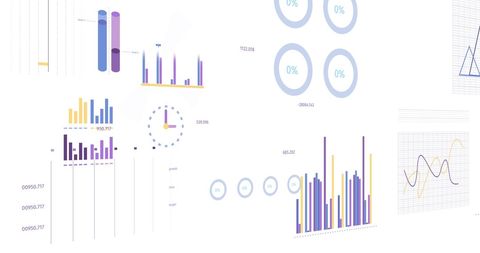
- Colorful Data Analytics Representations on Purple Background
Colorful Data Analytics Representations on Purple Background Image

Abstract visual representation of various data analytics elements, including pie charts, bar graphs, and line charts on a vibrant purple backdrop. Suitable for illustrating topics related to business analysis, data visualization, financial insights, or technology presentations. This digital artwork can add a modern, tech-savvy look to any business-related content or educational material about data processing.
Powered by  - Get 15% off with code: PIKWIZARD15


downloads
Tags:
More
Credit Photo
If you would like to credit the Photo, here are some ways you can do so
Text Link
photo Link
<span class="text-link">
<span>
<a target="_blank" href=https://pikwizard.com/photo/colorful-data-analytics-representations-on-purple-background/c3f7764c93bbc01af0b57ca6bc4bc2d7/>PikWizard</a>
</span>
</span>
<span class="image-link">
<span
style="margin: 0 0 20px 0; display: inline-block; vertical-align: middle; width: 100%;"
>
<a
target="_blank"
href="https://pikwizard.com/photo/colorful-data-analytics-representations-on-purple-background/c3f7764c93bbc01af0b57ca6bc4bc2d7/"
style="text-decoration: none; font-size: 10px; margin: 0;"
>
<img src="https://pikwizard.com/pw/medium/c3f7764c93bbc01af0b57ca6bc4bc2d7.jpg" style="margin: 0; width: 100%;" alt="" />
<p style="font-size: 12px; margin: 0;">PikWizard</p>
</a>
</span>
</span>
Free (free of charge)
Free for personal and commercial use.
Author: People Creations
Similar Free Stock Images

Premium


Premium

Premium


Premium


Premium

Premium


Premium

Premium

Premium

Premium


Premium


Premium

Premium


Premium


Premium


Premium


Premium


Premium


Premium

Premium

Premium


Premium

Premium

Premium


Premium


Explore More Free Stock Images