
- Home >
- Stock Photos >
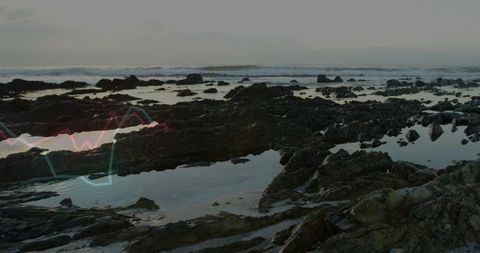
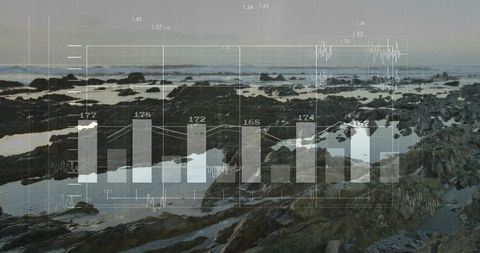
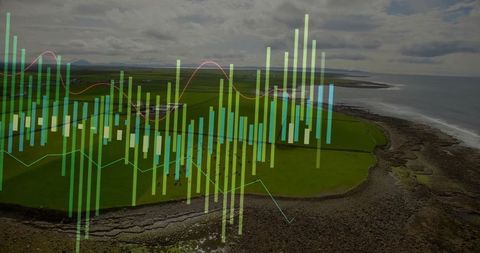
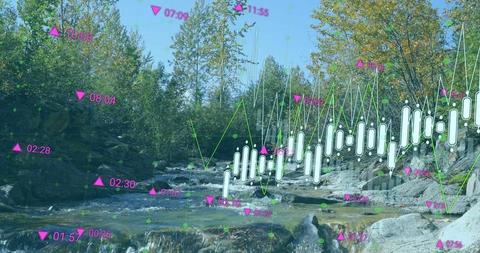
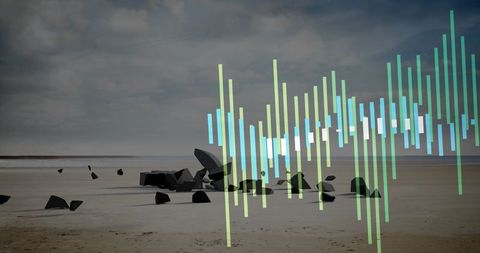
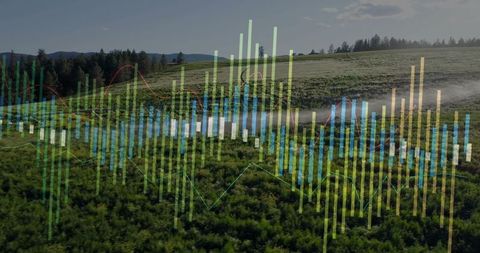
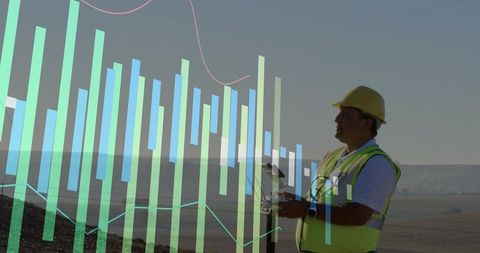
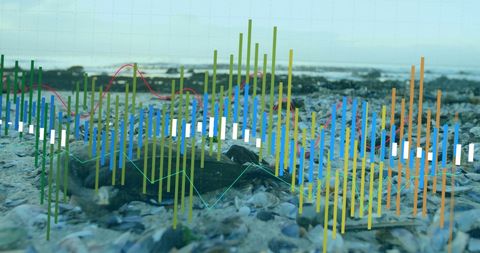
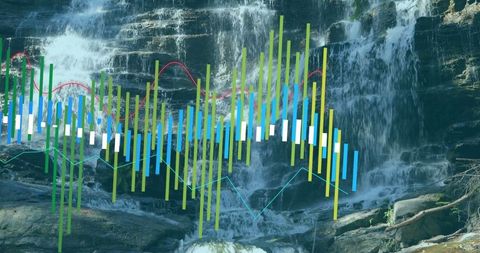
- Colorful Data Bars and Trend Lines on Rocky Shoreline Background
Colorful Data Bars and Trend Lines on Rocky Shoreline Background Image
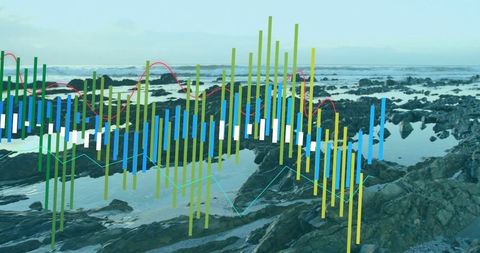
Colorful multicolored data bars and trend lines appear juxtaposed over a serene rocky shoreline at low tide. The combination of nature and technology beautifully illustrates analytics concepts in a natural setting. This image can be used in presentations or articles focusing on modern data analytics, technology's impact on nature studies, or for creative digital marketing campaigns related to coastal environments.
Powered by 


downloads
Tags:
More
Credit Photo
If you would like to credit the Photo, here are some ways you can do so
Text Link
photo Link
<span class="text-link">
<span>
<a target="_blank" href=https://pikwizard.com/photo/colorful-data-bars-and-trend-lines-on-rocky-shoreline-background/265c7a5c10e330be7c2339f707f3b3c6/>PikWizard</a>
</span>
</span>
<span class="image-link">
<span
style="margin: 0 0 20px 0; display: inline-block; vertical-align: middle; width: 100%;"
>
<a
target="_blank"
href="https://pikwizard.com/photo/colorful-data-bars-and-trend-lines-on-rocky-shoreline-background/265c7a5c10e330be7c2339f707f3b3c6/"
style="text-decoration: none; font-size: 10px; margin: 0;"
>
<img src="https://pikwizard.com/pw/medium/265c7a5c10e330be7c2339f707f3b3c6.jpg" style="margin: 0; width: 100%;" alt="" />
<p style="font-size: 12px; margin: 0;">PikWizard</p>
</a>
</span>
</span>
Free (free of charge)
Free for personal and commercial use.
Author: People Creations
Similar Free Stock Images
Loading...

Premium


Premium


Premium


Premium


Premium

Premium


Premium


Premium


Premium


Premium


Premium


Premium


Premium

Premium

Premium


Premium


Premium


Premium

Premium


Premium

Premium


Premium

Premium


Premium

Premium

Explore More Free Stock Images