- Home >
- Stock Photos >
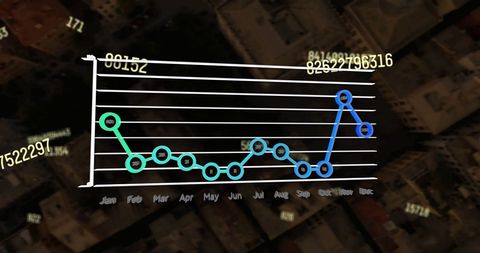
- Colorful Data Graph on Scientific Chalkboard Background
Colorful Data Graph on Scientific Chalkboard Background Image

The graph presenting data analysis dynamically traverses a dark background filled with chalkboard equations and scientific drawings. This digital illustration emphasizes themes of mathematics, scientific research, and data analytics. Perfect for educational materials, presentations in data analysis, or science-themed digital content.
Powered by  - Get 15% off with code: PIKWIZARD15


downloads
Tags:
More
Credit Photo
If you would like to credit the Photo, here are some ways you can do so
Text Link
photo Link
<span class="text-link">
<span>
<a target="_blank" href=https://pikwizard.com/photo/colorful-data-graph-on-scientific-chalkboard-background/92ebf3ef3aea06cda1def420cc826e10/>PikWizard</a>
</span>
</span>
<span class="image-link">
<span
style="margin: 0 0 20px 0; display: inline-block; vertical-align: middle; width: 100%;"
>
<a
target="_blank"
href="https://pikwizard.com/photo/colorful-data-graph-on-scientific-chalkboard-background/92ebf3ef3aea06cda1def420cc826e10/"
style="text-decoration: none; font-size: 10px; margin: 0;"
>
<img src="https://pikwizard.com/pw/medium/92ebf3ef3aea06cda1def420cc826e10.jpg" style="margin: 0; width: 100%;" alt="" />
<p style="font-size: 12px; margin: 0;">PikWizard</p>
</a>
</span>
</span>
Free (free of charge)
Free for personal and commercial use.
Author: Authentic Images
Similar Free Stock Images
Loading...


Premium


Premium


Premium


Premium


Premium


Premium

Premium

Premium


Premium


Premium


Premium


Premium


Premium


Premium

Premium

Premium


Premium

Premium

Premium

Premium