
- Home >
- Stock Photos >
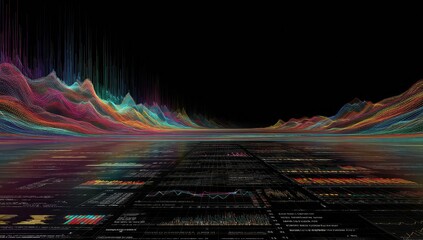
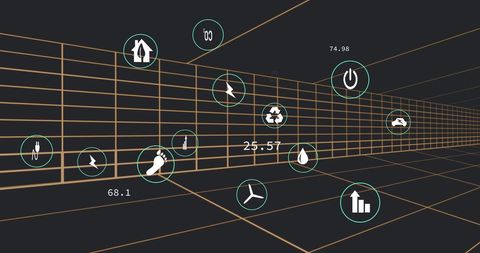
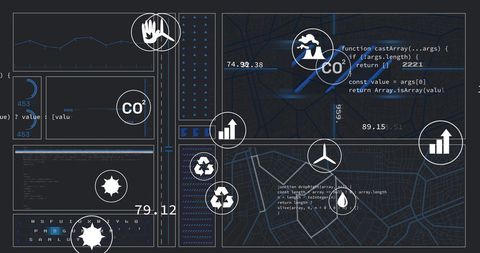
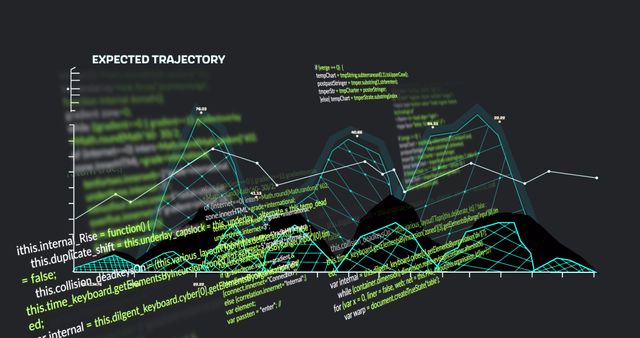
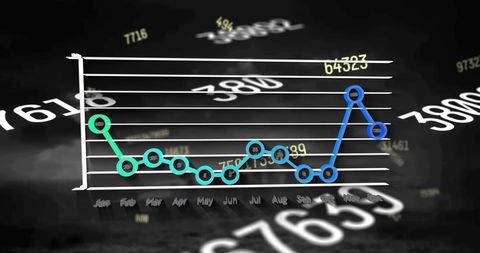
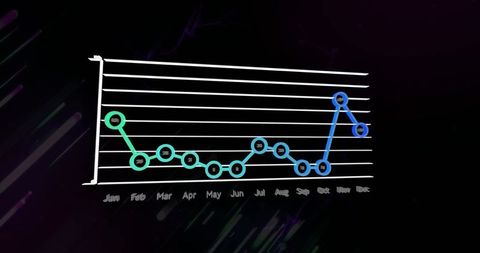
- Colorful Data Processing Graphs on Black Background
Colorful Data Processing Graphs on Black Background Image

Colorful lines and graphs over a black background, representing digital data processing and analytics. Useful for illustrating concepts in global finance, business intelligence, and data management. Ideal for technology presentations, financial websites, and analytical reports.
Powered by 


downloads
Tags:
More
Credit Photo
If you would like to credit the Photo, here are some ways you can do so
Text Link
photo Link
<span class="text-link">
<span>
<a target="_blank" href=https://pikwizard.com/photo/colorful-data-processing-graphs-on-black-background/d93f6e4678ed836cb13438be792c196f/>PikWizard</a>
</span>
</span>
<span class="image-link">
<span
style="margin: 0 0 20px 0; display: inline-block; vertical-align: middle; width: 100%;"
>
<a
target="_blank"
href="https://pikwizard.com/photo/colorful-data-processing-graphs-on-black-background/d93f6e4678ed836cb13438be792c196f/"
style="text-decoration: none; font-size: 10px; margin: 0;"
>
<img src="https://pikwizard.com/pw/medium/d93f6e4678ed836cb13438be792c196f.jpg" style="margin: 0; width: 100%;" alt="" />
<p style="font-size: 12px; margin: 0;">PikWizard</p>
</a>
</span>
</span>
Free (free of charge)
Free for personal and commercial use.
Author: Authentic Images
Similar Free Stock Images

Premium


Premium


Premium


Premium


Premium

Premium


Premium


Premium


Premium


Premium


Premium


Premium

Premium

Premium


Premium

Premium


Premium


Premium


Premium

Premium

Premium

Premium


Premium


Premium


Premium

Explore More Free Stock Images