- Home >
- Stock Photos >
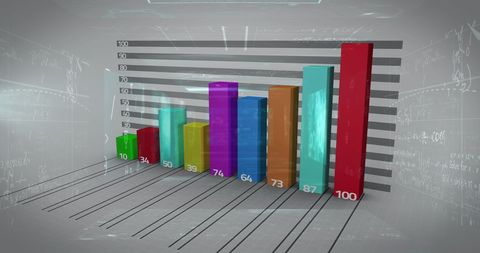
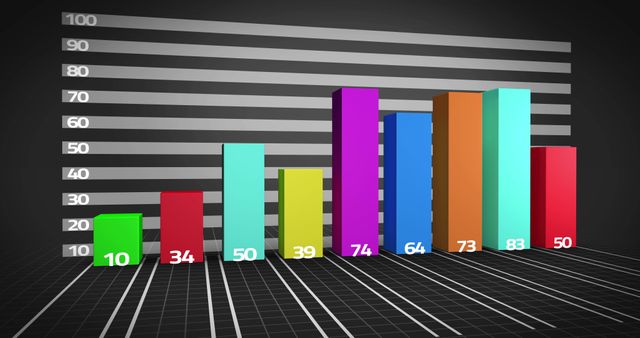
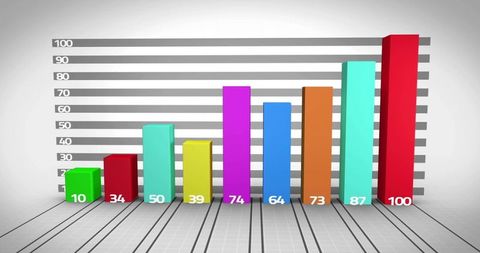
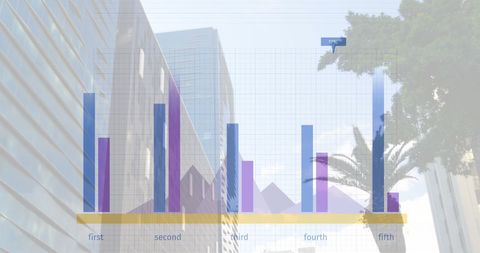
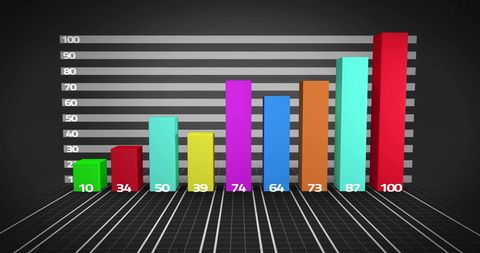
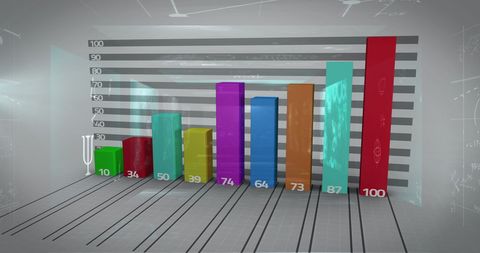
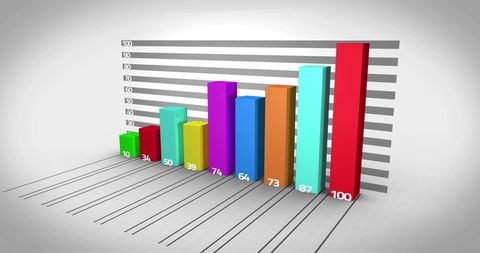
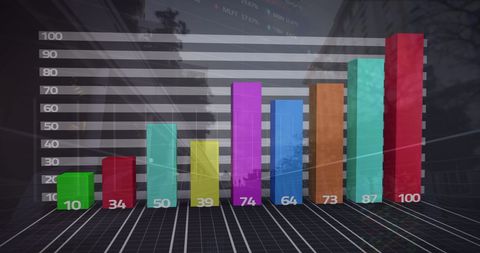
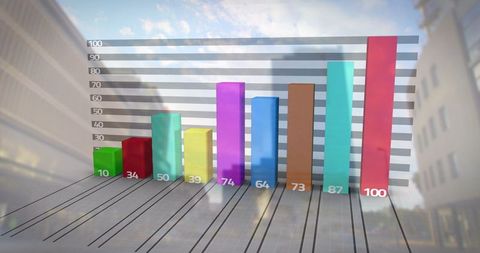
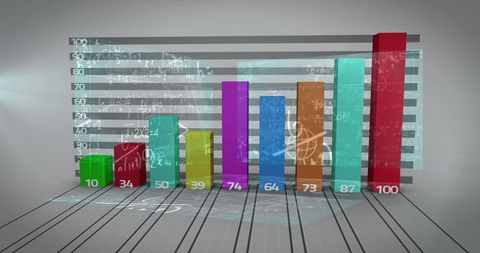
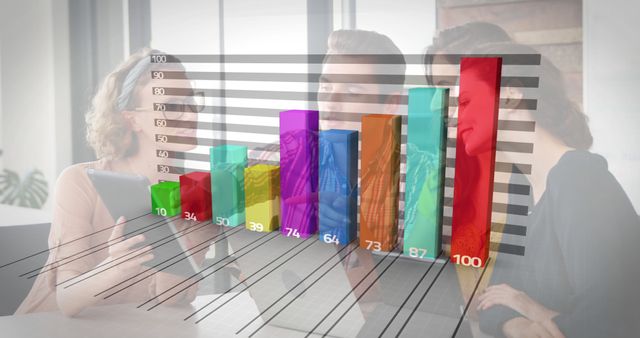
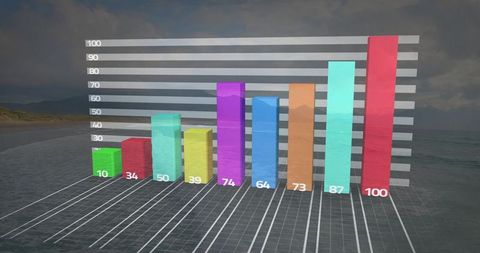
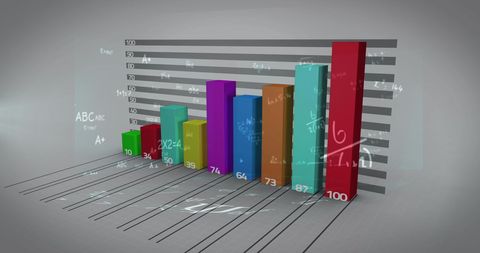
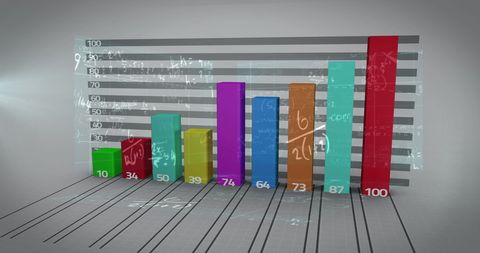
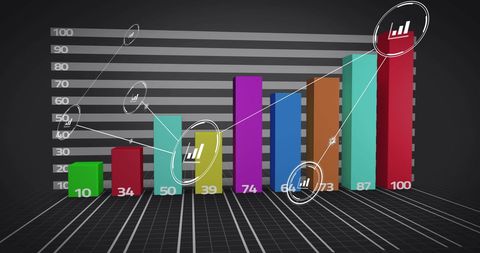
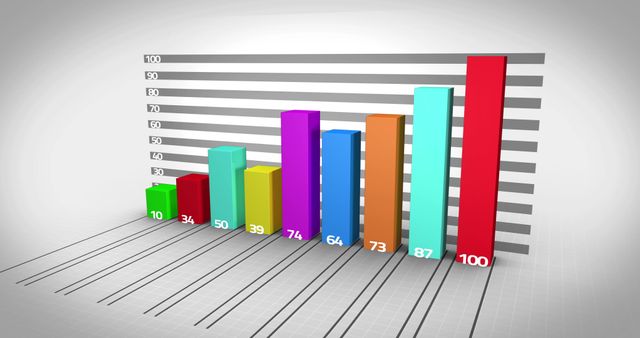
- Colorful Data Visualization and Analysis Concept
Colorful Data Visualization and Analysis Concept Image

Various colorful graphs and charts representing data processing on a clean, white background. This image suggests a focus on global business and digital interfaces, ideal for use in presentations or marketing materials related to analytics, business trends, economic growth, statistical reporting, or corporate strategy. Suitable for conveying a modern approach to data-driven decision-making.

downloads
Tags:
More
Credit Photo
If you would like to credit the Photo, here are some ways you can do so
Text Link
photo Link
<span class="text-link">
<span>
<a target="_blank" href=https://pikwizard.com/photo/colorful-data-visualization-and-analysis-concept/36460e97a2df8da090618a8acc131741/>PikWizard</a>
</span>
</span>
<span class="image-link">
<span
style="margin: 0 0 20px 0; display: inline-block; vertical-align: middle; width: 100%;"
>
<a
target="_blank"
href="https://pikwizard.com/photo/colorful-data-visualization-and-analysis-concept/36460e97a2df8da090618a8acc131741/"
style="text-decoration: none; font-size: 10px; margin: 0;"
>
<img src="https://pikwizard.com/pw/medium/36460e97a2df8da090618a8acc131741.jpg" style="margin: 0; width: 100%;" alt="" />
<p style="font-size: 12px; margin: 0;">PikWizard</p>
</a>
</span>
</span>
Free (free of charge)
Free for personal and commercial use.
Author: Authentic Images