1. Home > 
  2. Stock Photos > 
  3. Colorful Data Visualization Over Digital Background

Colorful Data Visualization Over Digital Background Image

Colorful Data Visualization Over Digital Background

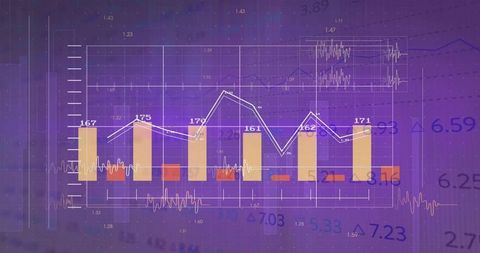
Abstract bar chart against digital background combining networking and finance imagery, illustrating analysis of stock market data in technological context. Useful for technology companies, financial reports, data analytics presentations, and educational materials about data trends and networks in digital environments.

Powered by Shutterstock logo - Get 15% off with code: PIKWIZARD15
Financial chart and investment graph analysis stock on tablet screen. Data dashboard and report insight for finance growth, stock market, and business performance strategy. - Powered by Shutterstock - Get 15% off with code: PIKWIZARD15Futuristic Digital Growth Chart – 3D Bar Graph with Glowing Blue Data Visualization - Powered by Shutterstock - Get 15% off with code: PIKWIZARD15Financial graph with a red falling trend line overlay on a cityscape background, symbolizing a market downturn and financial crisis - Powered by Shutterstock - Get 15% off with code: PIKWIZARD15Display of quotes pricing graph visualization.  Financial statistic analysis on dark background with growing financial charts. Stock analyzing. Price chart bars.  - Powered by Shutterstock - Get 15% off with code: PIKWIZARD15Modern hands on data analytics with digital bar charts and metrics. Laptop and keyboard in focus. Perfect for business, finance, trend, and real people stock themes.

 - Powered by Shutterstock - Get 15% off with code: PIKWIZARD15

Credit Photo

If you would like to credit the Photo, here are some ways you can do so

Free (free of charge)

Free for personal and commercial use.

Author: People Creations

Similar Free Stock Images

Digital Financial Data Analyzing with Bar and Line Graphs on Screen
Premium
Displaying green blue red trend lines on dark grid trading screen, showing +11.73% +6.31%. Financial analysis, data visualization, stock market, technical chart, digital dashboard, investment,
Digital Financial Data and Market Analytics Concept
Visualizing Stock Market and Data Analytics Trends
Digital Data Interface on World Map Focusing Global Business Analytics
Vibrant Bar Graph and Digital Data Analysis Interface
Premium
Resting golf ball by red flagstick on putting green, showing candlestick bars, graphs, numeric data. Sport, finance, analytics, investment, market, strategic, outdoor
Abstract Financial Data and Cityscape on Green Background
Digital Stock Market Data Visualization with Graphs
Financial Data Processing Over Digital Cityscape
Colombian Stock Market Data Amid Colored Background
Premium
Stock chart displaying over rural fields at dawn, with lines candlestick bars percents gridlines. Financial analysis, data visualization, rural landscape, nature backdrop, sunrise, sunset, scenic
Digital Financial Graph Illustrating Stock Market Trends
Dynamic Data Visualizations on Multiple Screens
Dynamic Financial Data Chart on Blue Background
Secure Data Analytics with Financial Graphs and Padlock Over Ukraine Flag
Premium
Stock market graph and bar chart price display. Data on live computer screen. Display of quotes pricing graph visualization. Abstract financial background trade colorful
Dynamic Data Graph with Futuristic Technology Background
Dynamic Financial Data with Global Connections and Insights
Innovative Digital Finance Data Display on Dark Interface
Colorful Stacked Bar Chart with Data Analysis Elements
Premium
Displaying line chart fluctuating on market terminal, with green bars, percentages and grid overlay. Analytics, data visualization, finance, technology, digital interface, investment, performance
Colorful Bar and Line Charts Analyzing Financial Data Over Dark Background
Financial Data and Bar Graphs on Digital Interface Background
Digital Display of Financial Charts and Graphs in Dark Mode
Abstract Digital Interface with Data Bars on Gradient Background
Premium
Dark blue grid filling screen when green bars rising while candlestick line animating marking peaks. Analytics, finance, data visualization, dashboard, digital interface, stock market, performance
Futuristic Technology Stacked Bar Chart Visualization
Interactive Data Chart with Bar Graph and Line Analysis
Digital Data Visualization with Bars and Waveforms
Abstract Digital Dashboard Showing Data Analytics with Graphs and Code
Financial Data Charts on Digital Interface Background
Financial Data Charts in Blue Digital Interface Background
Premium
Hands holding a tablet with glowing bar and line charts, global map, and financial data visuals on a dark background. Concept of stock market analytics
Digital Bar Graph Display in Financial Data Analysis
Digital Financial Chart and Chemical Structurals Illustration
Dynamic Stock Market Trends with Digital Data Insights
Global Data Analysis with Virus Imagery in Background
Premium
Green zigzag line fluctuating in virtual interface, with red bars, grid lines and numeric labels. Data analysis, financial technology, digital visualization, stock market, data analytics, business
Futuristic Data Analysis with Bar Graphs and Charts Overlay
Financial Data Analysis Display with Colorful Graphs
Colombian Flag Merging with Stock Market Graphs Illustrating Economy
Financial Data Graph Overlay in Modern Office Environment
Premium
Data on live computer screen. Display of quotes pricing graph visualization. Stock market graph and bar chart price display. Abstract financial background trade colorful
City Skyline with Abstract Financial Graph Overlay
Digital Financial Data Analysis with Vibrant Graphs
Digital Financial Data Analysis and Stock Market Charting
Colorful Financial Data Analytics and Digital Graph
Premium
Businessman using virtual touchscreen interface to analyze digital financial chart, with candlestick graph, bar chart and data visualization for investment planning, strategy and fintech innovation
Financial Data Analysis with Dynamic Growth Charts
Dynamic Financial Growth Chart with Digital Data Streams
Digital Financial Data Representation with Bar and Line Graphs
Colorful Stock Market Candlestick Chart on Digital Grid
Premium
Displaying digital chart on trading desk, with candlestick bars, trend lines and numeric data. Finance, technology, analytics, data visualization, investment, stock market, dashboard
Financial Data Processing with Molecular Overlay in a Digital Interface
Financial Data Processing Over Armenian Flag Background
Abstract Digital Financial Data Graph Chart
Dynamic Financial Dashboard Displaying Bar and Line Charts
Premium
Displaying green bars red trend line, candlestick-line charts on world map in grid terminal display. Financial technology, data visualization, digital interface, stock market, global analytics,
Finance Data Visualization on Digital Dashboard with Candlestick Bars
Digital Candlestick Chart on Virtual Grid in Blue Tone
Dynamic Financial Data with Glowing Candlestick Chart and Digital Numbers
Complex Financial Data Analysis on Purple Grid Background
Financial Data Analysis Over Vibrant Cityscape Background
Financial Charts with Upward Trend and Analysis Tools
Premium
Displaying widescreen finance board showing market trends in trading office with tickers and charts. Technology, analytics, investment, visualization, business, digital, enterprise
Data Analytics Charts on Digital Interface
Digital Interface of Social Media Over Data Analytics
Dynamic Stock Market Graphics on Modern Digital Interface
Abstract Financial Graphs Overlapping Data Center
Premium
City skyline with high-rise buildings overlaid with a graphic financial bar chart, against a clear blue sky. Concept of urban economics and finance
Global Financial Data Processing with Bar Chart Visualization
Statistical Data and Trends Over Digital Grid Overlay
Digital Interface with Global Business Data Visualization
Financial Data Analysis with Stock Market Trends and Graphs
Premium
A hand holding a financial chart with rising arrows on a dark background, symbolizing growth and success in business concepts
Financial Data Processing with Digital Graphs and Numbers
Global Financial Data on Virtual Screen Displaying Stock Market Trends
Financial Data Analytics with Environmental Sustainability Icons
Digital Data Processing with DNA Helix Overlay
Premium
Businessman using tablet to analyze stock market chart with candlestick graph, bar chart, and upward arrow showing growth, investment strategy, and financial success concept
Dynamic Display of Financial Graphs and Stock Market Data
Colorful Candlestick Chart on Digital Financial Interface
Dynamic Colored Bar Graph with Digital Data Background
Digital Analytics Visualization with Bar and Line Graphs
Premium
3D bar chart alternating green red bars rising in virtual data space, with trend-arrows over ticker. Finance, data visualization, analytics, technology, digital economy, investment, stock market
Animated Financial Graph with Candlestick Chart
Digital Graph and Data Analysis with Financial Growth Trends
Stacked Bar Chart with Skyline on Rooftop Terrace
Cybersecurity Dashboard Displaying Code and Analytics Chart
Premium
White candlestick chart fluctuating on financial trading platform, with line graphs and lens flare. Data visualization, financial analytics, charting, stock market, investment, technology, digital
Digital Financial Dashboard with Bar and Line Charts
Futuristic Trading Dashboard Visualizing Stock Market Data with Radial Infographic
Interactive Financial Graph on Digital Grid Background
Digital Interface with Financial Data Analytics and Graphs
Ukraine Crisis Financial Graphs Overlay
Abstract Financial Graph Display on Dark Background
Premium
Stock Statistic Analysis Information Chart Bar Data Concept
Digital Financial Market Trends and Data Visualization
Data Analytics and Stock Market Graphs
Global Financial Data and Statistics with Blue World Map Overlay
Modern Office with Data Analytics Visualization Overlay
Premium
Financial chart with glowing bars, lines, and data points, hand interacting with holographic interface on dark background. Concept of market analysis
Analyzing Financial Data on Computer Screens with Headphones in Office
Colorful Data Analytics Bar Graphs on Digital Screen
Abstract Graphic Business Data Visualization
Abstract Financial Data Analysis and Stock Market Trends
Premium
Digital financial charts overlay Manhattan skyline at night, showcasing glowing graphs, data points, and analysis. Concept of trading and investing
Financial Data Processing Over Digital Grid
Dynamic Financing Data Visualization on Hungary Flag
Digital Data Visualization with Global Network Connections
Financial Data Trends Merging with EU and Ukraine Flags
Premium
Displaying market overlay floating over downtown night skyline, with bar charts line graphs tickers. Futuristic, neon, digital, innovation, technology, data visualization, urban
Financial Data Analysis with Graphs and Charts on Dark Background
Colorful Data Analytics Display on Dark Background
Dynamic Financial Data Visualization with Binary Code Overlay
Finance Transforming with DNA and Digital Technology
Premium
Displaying vertical bar chart overlaying white and magenta lines on desk, with blurred coin stacks. Financial analysis, data visualization, investment growth, business intelligence, digital finance
Colorful Bar Graph Illustrating Data Analysis Trends
Digital Finance Dashboard Analyzing EconomicData Trends
Data Visualization Merging Cyber Security Code Elements with Analytics Graphs
Modern Multi-Colored Financial Graphs on Digital Dashboard
Premium
Businessman typing on laptop with glowing virtual stock market graph showing financial growth, investment analytics, performance metrics, and economic data visualization.
Displaying Neon Financial Candlestick and Bar Dashboard with Line Graphs and Halftone Grid