
- Home >
- Stock Photos >
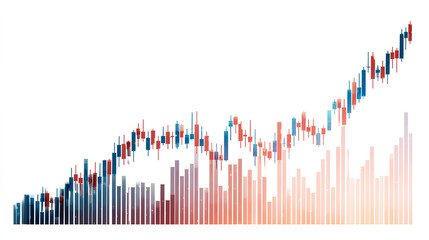
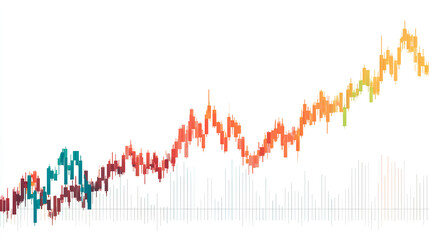
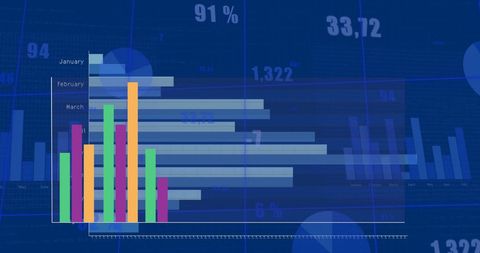
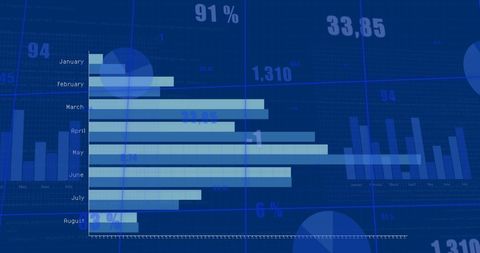
- Colorful Data Visualization with Bar Graphs and Statistics Overlay
Colorful Data Visualization with Bar Graphs and Statistics Overlay Image

This colorful illustration highlights data analysis using bar graphs and statistics. Suited for presentations, business reports, or articles focusing on analytics or modern technology. Ideal for visually conveying complex information in a clear, engaging way.
Powered by 


downloads
Tags:
More
Credit Photo
If you would like to credit the Photo, here are some ways you can do so
Text Link
photo Link
<span class="text-link">
<span>
<a target="_blank" href=https://pikwizard.com/photo/colorful-data-visualization-with-bar-graphs-and-statistics-overlay/72fb4234295e7ea3a45db2fc6c5004bc/>PikWizard</a>
</span>
</span>
<span class="image-link">
<span
style="margin: 0 0 20px 0; display: inline-block; vertical-align: middle; width: 100%;"
>
<a
target="_blank"
href="https://pikwizard.com/photo/colorful-data-visualization-with-bar-graphs-and-statistics-overlay/72fb4234295e7ea3a45db2fc6c5004bc/"
style="text-decoration: none; font-size: 10px; margin: 0;"
>
<img src="https://pikwizard.com/pw/medium/72fb4234295e7ea3a45db2fc6c5004bc.jpg" style="margin: 0; width: 100%;" alt="" />
<p style="font-size: 12px; margin: 0;">PikWizard</p>
</a>
</span>
</span>
Free (free of charge)
Free for personal and commercial use.
Author: Authentic Images
Similar Free Stock Images

Premium

Premium


Premium


Premium


Premium

Premium

Premium


Premium


Premium


Premium


Premium


Premium


Premium


Premium


Premium

Premium


Premium


Premium


Premium


Premium


Premium


Premium


Premium


Premium


Premium

Explore More Free Stock Images