
- Home >
- Stock Photos >
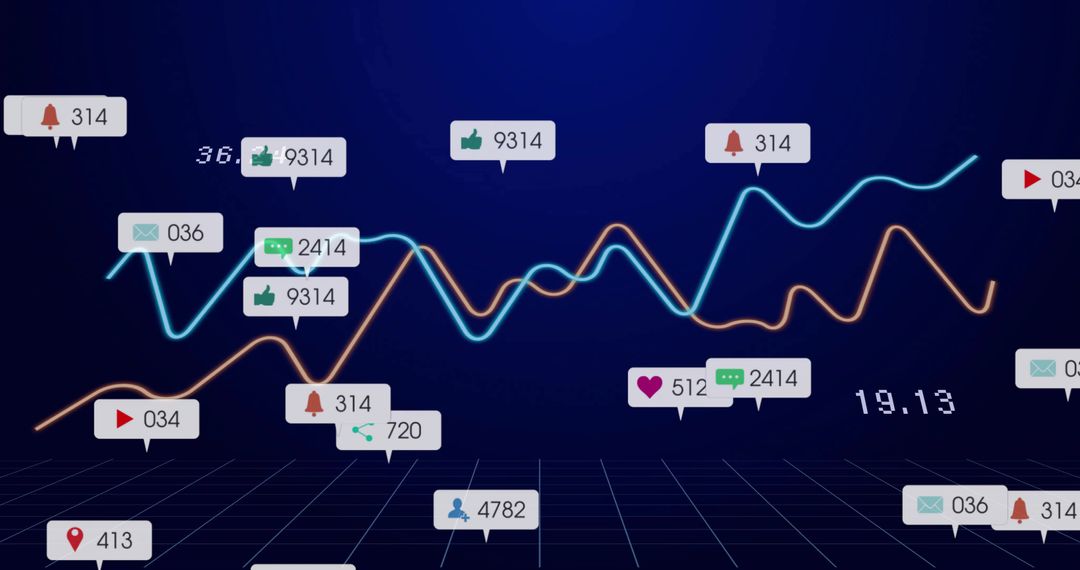
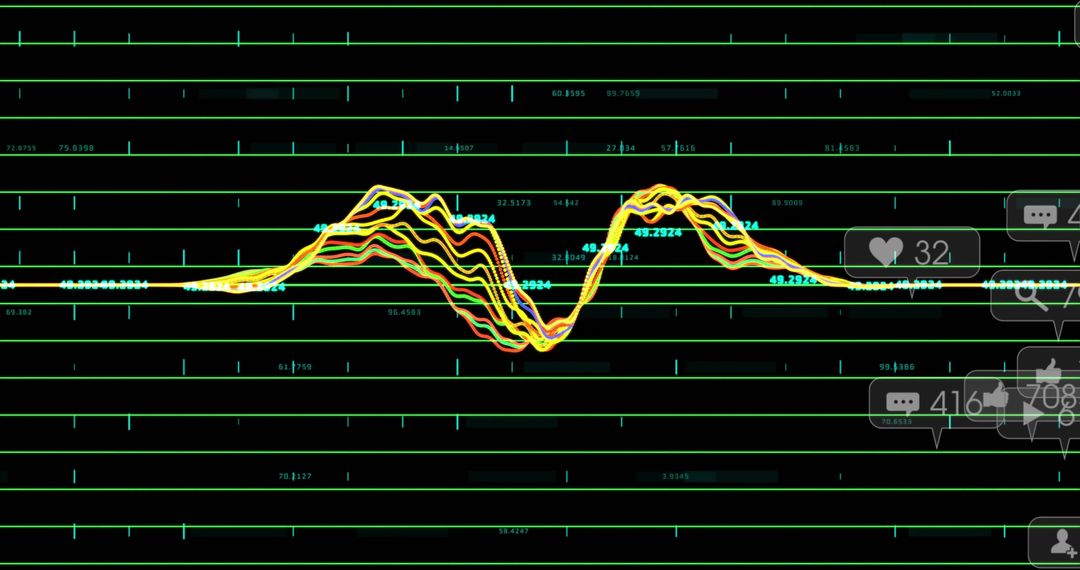
- Colorful Data Visualization with Social Icons on Neon Grid Screen
Colorful Data Visualization with Social Icons on Neon Grid Screen Image

Dynamic visual displaying an intricate multi-colored line graph overlaid on a futuristic neon grid screen, accompanied by social media icons symbolizing interaction metrics like likes, messages, and views. Ideal for presentations on digital interface designs, trends in user analytics, or technologies related to social media platforms. Utilized in web projects, digital marketing materials, or analytics workshops emphasizing engaging visual data interpretations.
Powered by  - Get 15% off with code: PIKWIZARD15


0
downloads
downloads
Tags:
More
Credit Photo
If you would like to credit the Photo, here are some ways you can do so
Text Link
photo Link
<span class="text-link">
<span>
<a target="_blank" href=https://pikwizard.com/photo/colorful-data-visualization-with-social-icons-on-neon-grid-screen/d7bad1f470edb04e8f213ecafd96e465/>PikWizard</a>
</span>
</span>
<span class="image-link">
<span
style="margin: 0 0 20px 0; display: inline-block; vertical-align: middle; width: 100%;"
>
<a
target="_blank"
href="https://pikwizard.com/photo/colorful-data-visualization-with-social-icons-on-neon-grid-screen/d7bad1f470edb04e8f213ecafd96e465/"
style="text-decoration: none; font-size: 10px; margin: 0;"
>
<img src="https://pikwizard.com/pw/medium/d7bad1f470edb04e8f213ecafd96e465.jpg" style="margin: 0; width: 100%;" alt="" />
<p style="font-size: 12px; margin: 0;">PikWizard</p>
</a>
</span>
</span>
Free (free of charge)
Free for personal and commercial use.
Author: Awesome Content
Similar Free Stock Images

Premium


Premium


Premium


Premium


Premium


Premium


Premium


Premium


Premium


Premium


Premium


Premium


Premium


Premium


Premium


Premium


Premium


Premium


Premium


Premium


Premium


Premium


Premium


Premium

