
- Home >
- Stock Photos >
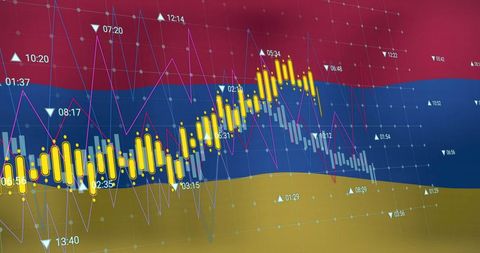
- Colorful Data Visualizations on a Digital Dashboard Background
Colorful Data Visualizations on a Digital Dashboard Background Image

Colorful graphs and charts spread across a digital screen enable users to explore data trends and analysis comprehensively. Vivid colors and dynamic layouts make it ideal for presentations, educational tools, or websites focused on data-driven insights and statistical evaluations. Frequent application in business analytics sectors and educational institutions for enhancing visual learning experiences.
Powered by 


downloads
Tags:
More
Credit Photo
If you would like to credit the Photo, here are some ways you can do so
Text Link
photo Link
<span class="text-link">
<span>
<a target="_blank" href=https://pikwizard.com/photo/colorful-data-visualizations-on-a-digital-dashboard-background/8052b71aea360d684b1ddce8f4bb7a3a/>PikWizard</a>
</span>
</span>
<span class="image-link">
<span
style="margin: 0 0 20px 0; display: inline-block; vertical-align: middle; width: 100%;"
>
<a
target="_blank"
href="https://pikwizard.com/photo/colorful-data-visualizations-on-a-digital-dashboard-background/8052b71aea360d684b1ddce8f4bb7a3a/"
style="text-decoration: none; font-size: 10px; margin: 0;"
>
<img src="https://pikwizard.com/pw/medium/8052b71aea360d684b1ddce8f4bb7a3a.jpg" style="margin: 0; width: 100%;" alt="" />
<p style="font-size: 12px; margin: 0;">PikWizard</p>
</a>
</span>
</span>
Free (free of charge)
Free for personal and commercial use.
Author: Authentic Images
Similar Free Stock Images

Premium


Premium


Premium

Premium


Premium


Premium


Premium


Premium


Premium


Premium

Premium


Premium


Premium

Premium


Premium

Premium

Premium


Premium


Premium


Premium

Premium

Premium


Premium


Premium


Premium


Explore More Free Stock Images