
- Home >
- Stock Photos >
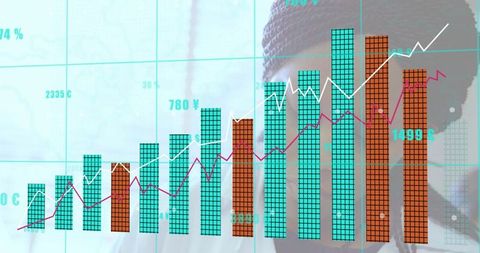
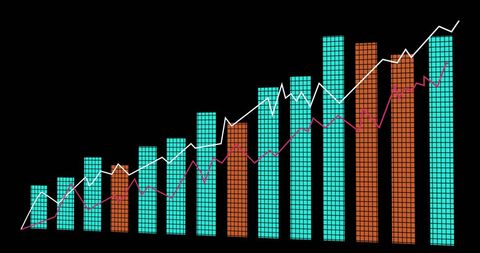
- Colorful Digital Bar Graph Data Analysis Concept
Colorful Digital Bar Graph Data Analysis Concept Image

Dynamic and colorful digital bar graph visualizing complex data concepts. Lines and charts illustrate upward trends and market data, perfect for illustrating business analytics or financial growth. Useful for presentations, reports, or educational materials focusing on data analysis, technology, and market trends.
Powered by  - Get 15% off with code: PIKWIZARD15


downloads
Tags:
More
Credit Photo
If you would like to credit the Photo, here are some ways you can do so
Text Link
photo Link
<span class="text-link">
<span>
<a target="_blank" href=https://pikwizard.com/photo/colorful-digital-bar-graph-data-analysis-concept/b948ea2bda3e2df9e5b7066637b6bccc/>PikWizard</a>
</span>
</span>
<span class="image-link">
<span
style="margin: 0 0 20px 0; display: inline-block; vertical-align: middle; width: 100%;"
>
<a
target="_blank"
href="https://pikwizard.com/photo/colorful-digital-bar-graph-data-analysis-concept/b948ea2bda3e2df9e5b7066637b6bccc/"
style="text-decoration: none; font-size: 10px; margin: 0;"
>
<img src="https://pikwizard.com/pw/medium/b948ea2bda3e2df9e5b7066637b6bccc.jpg" style="margin: 0; width: 100%;" alt="" />
<p style="font-size: 12px; margin: 0;">PikWizard</p>
</a>
</span>
</span>
Free (free of charge)
Free for personal and commercial use.
Author: Authentic Images
Similar Free Stock Images

Premium


Premium


Premium


Premium


Premium

Premium


Premium


Premium

Premium

Premium


Premium

Premium


Premium


Premium


Premium


Premium


Premium

Premium


Premium


Premium

Premium


Premium


Premium


Premium


Premium


Explore More Free Stock Images