- Home >
- Stock Photos >
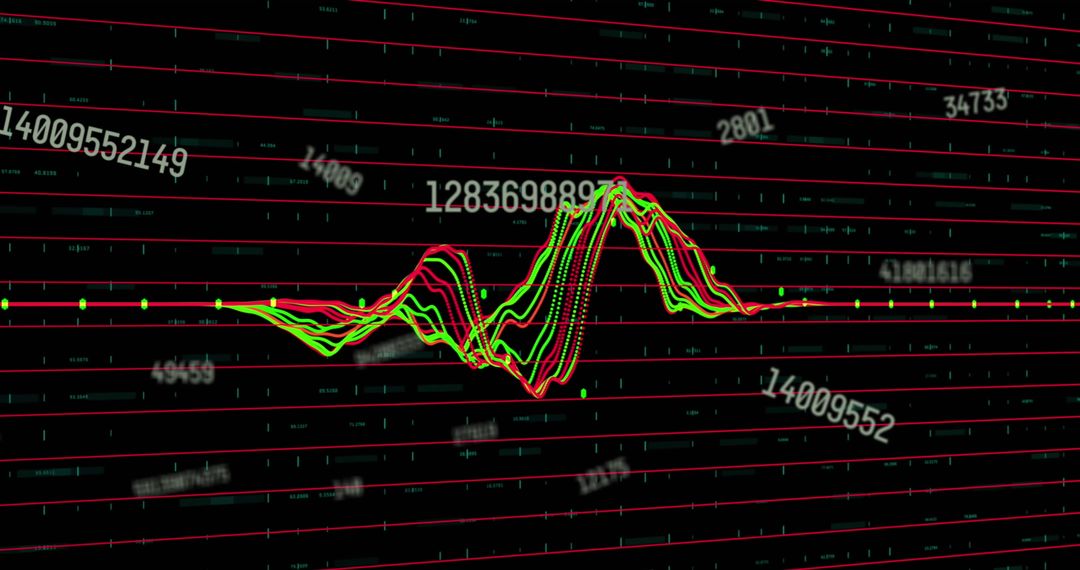
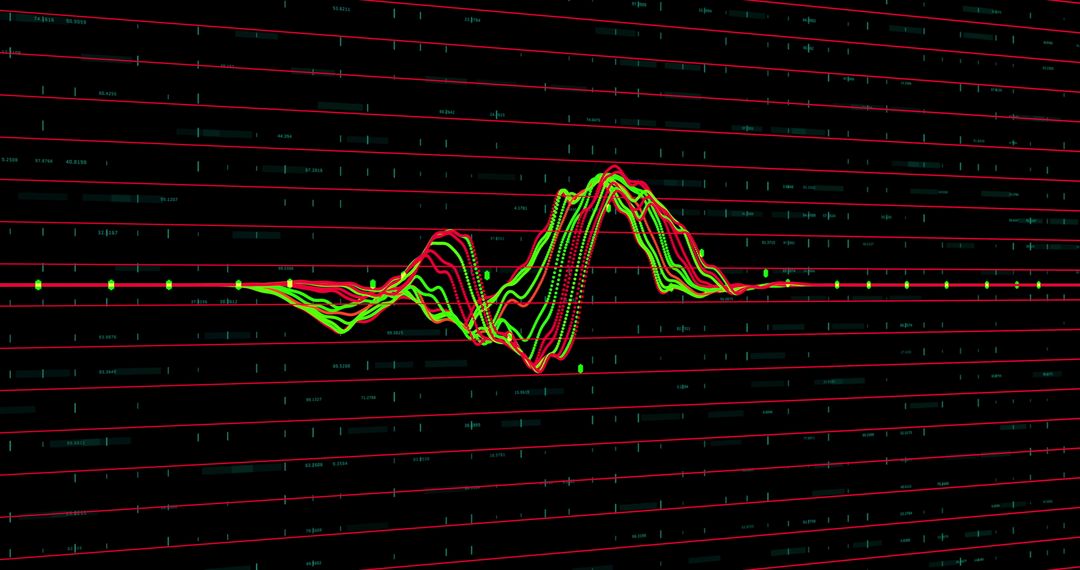
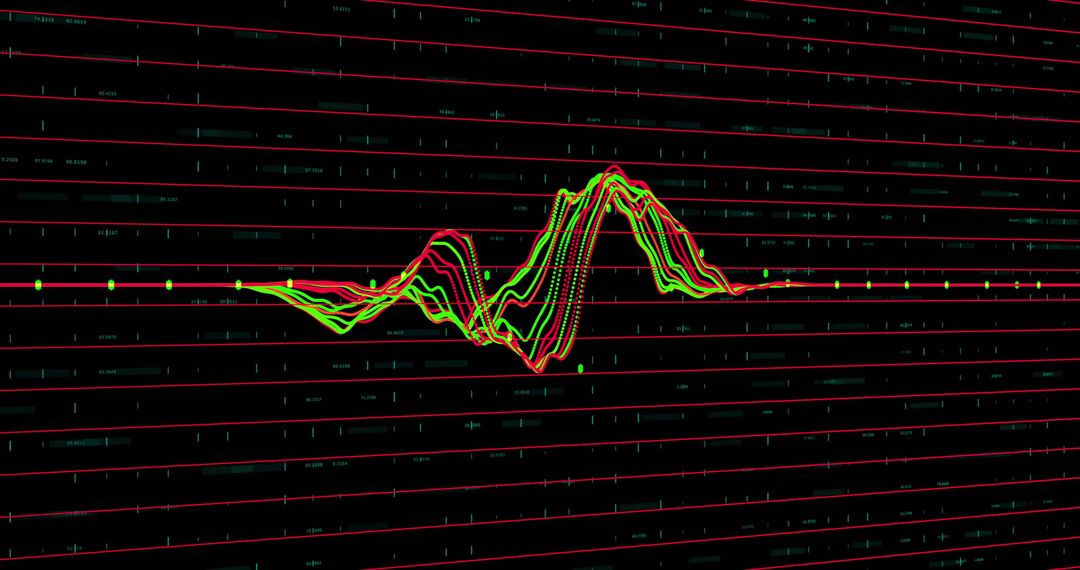
- Colorful Digital Waveform with Analytical Overlay and Red Grid Lines
Colorful Digital Waveform with Analytical Overlay and Red Grid Lines Image

Digital visualization showcases dynamic colorful waveform on grid with red lines and candlestick patterns. Perfect for presentations on analytics, data technology, digital dashboards, and interactive interfaces. Add vibrancy to tech articles or marketing materials featuring cutting-edge data analysis tools.
Powered by  - Get 15% off with code: PIKWIZARD15


0
downloads
downloads
Tags:
More
Credit Photo
If you would like to credit the Photo, here are some ways you can do so
Text Link
photo Link
<span class="text-link">
<span>
<a target="_blank" href=https://pikwizard.com/photo/colorful-digital-waveform-with-analytical-overlay-and-red-grid-lines/e30cc757cd539d368c5d90200a5ccabe/>PikWizard</a>
</span>
</span>
<span class="image-link">
<span
style="margin: 0 0 20px 0; display: inline-block; vertical-align: middle; width: 100%;"
>
<a
target="_blank"
href="https://pikwizard.com/photo/colorful-digital-waveform-with-analytical-overlay-and-red-grid-lines/e30cc757cd539d368c5d90200a5ccabe/"
style="text-decoration: none; font-size: 10px; margin: 0;"
>
<img src="https://pikwizard.com/pw/medium/e30cc757cd539d368c5d90200a5ccabe.jpg" style="margin: 0; width: 100%;" alt="" />
<p style="font-size: 12px; margin: 0;">PikWizard</p>
</a>
</span>
</span>
Free (free of charge)
Free for personal and commercial use.
Author: Creative Art
Similar Free Stock Images

Premium


Premium


Premium


Premium


Premium


Premium


Premium


Premium


Premium


Premium


Premium


Premium


Premium


Premium


Premium


Premium


Premium


Premium


Premium


Premium


Premium


Premium


Premium


Premium