- Home >
- Stock Photos >
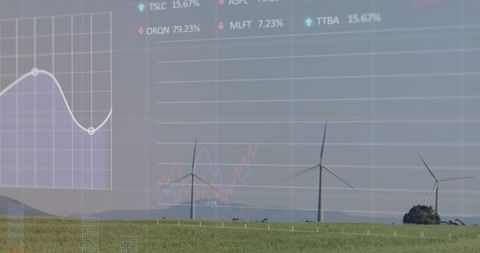
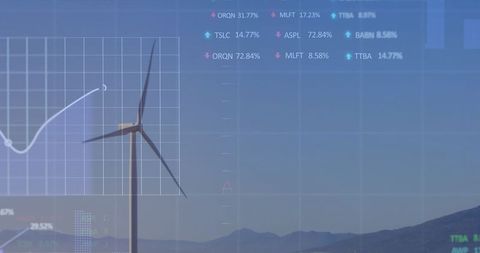
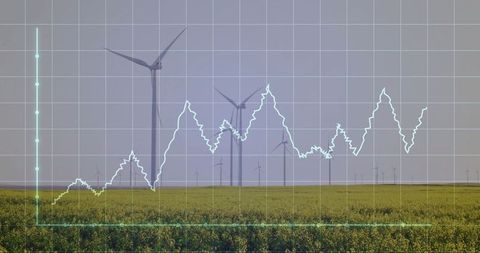
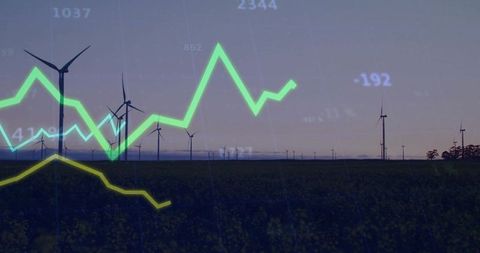
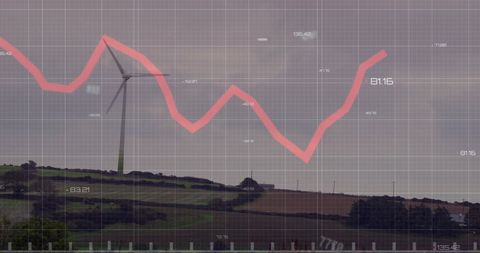
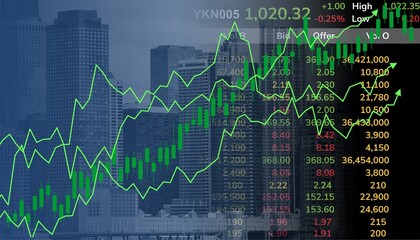
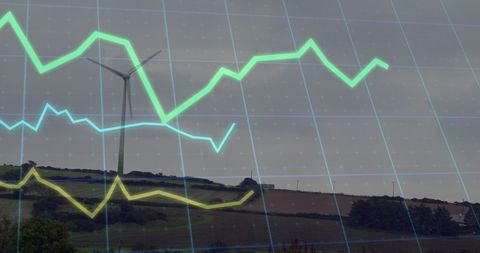
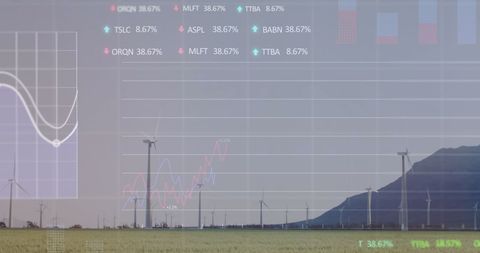
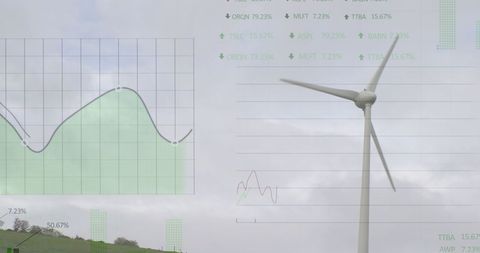
- Colorful Financial Charts Showing Stock Market Trends and Analysis
Colorful Financial Charts Showing Stock Market Trends and Analysis Image
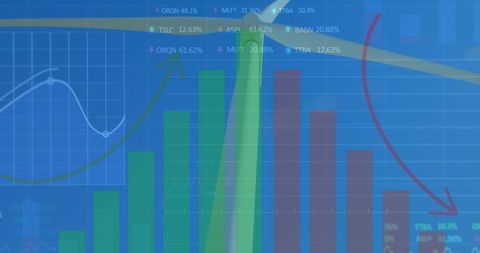
This visualization shows diverse financial charts encompassing stock market indicators and trends. It serves as a valuable asset in presentations about financial analysis and investment strategies. Analysts, investors, and educators can use it to illustrate stock market behavior and data-driven decision-making.
Powered by 


2
downloads
downloads
Tags:
More
Credit Photo
If you would like to credit the Photo, here are some ways you can do so
Text Link
photo Link
<span class="text-link">
<span>
<a target="_blank" href=https://pikwizard.com/photo/colorful-financial-charts-showing-stock-market-trends-and-analysis/3c5990676367d1661a31d9ca69ad11a6/>PikWizard</a>
</span>
</span>
<span class="image-link">
<span
style="margin: 0 0 20px 0; display: inline-block; vertical-align: middle; width: 100%;"
>
<a
target="_blank"
href="https://pikwizard.com/photo/colorful-financial-charts-showing-stock-market-trends-and-analysis/3c5990676367d1661a31d9ca69ad11a6/"
style="text-decoration: none; font-size: 10px; margin: 0;"
>
<img src="https://pikwizard.com/pw/medium/3c5990676367d1661a31d9ca69ad11a6.jpg" style="margin: 0; width: 100%;" alt="" />
<p style="font-size: 12px; margin: 0;">PikWizard</p>
</a>
</span>
</span>
Free (free of charge)
Free for personal and commercial use.
Author: People Creations
Similar Free Stock Images

Premium


Premium


Premium


Premium


Premium


Premium


Premium


Premium


Premium


Premium


Premium


Premium


Premium


Premium


Premium


Premium


Premium


Premium


Premium


Premium


Premium


Premium


Premium


Premium


Premium