1. Home > 
  2. Stock Photos > 
  3. Colorful Financial Data Chart with Digital Grid Overlay

Colorful Financial Data Chart with Digital Grid Overlay Image

Colorful Financial Data Chart with Digital Grid Overlay

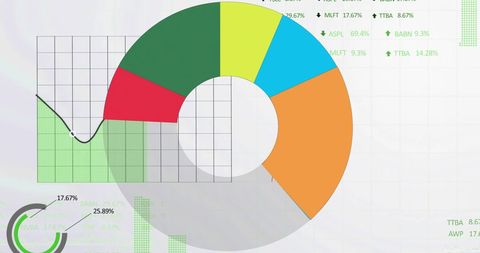
This visual creatively displays financial data with a ring chart overlaid on a digital grid background. Ideal for presentations or reports focusing on market trends, investment analysis and strategic business insights. Use for educational purposes in teaching financial literacy or graph interpretation.

Powered by Shutterstock logo - Get 15% off with code: PIKWIZARD15
Forex market charts on computer display. Business analysis diagram. Candle stick graph chart. Share price candlestick chart. Fundamental and technical analysis concept. Price chart bars.  - Powered by Shutterstock - Get 15% off with code: PIKWIZARD15Displaying fingerprint line scanning on security screen, with stock grid and candlestick chart. Cybersecurity, finance, digital, biometric, analytics, data visualization, control room - Powered by Shutterstock - Get 15% off with code: PIKWIZARD15Image of financial data processing over grid. Global business, finances, computing and data processing concept digitally generated image. - Powered by Shutterstock - Get 15% off with code: PIKWIZARD15AI Artificial intelligence with electric connections in the background - Powered by Shutterstock - Get 15% off with code: PIKWIZARD15Image of graph with data processing over grid and landfill site. Global technology, finances and digital interface concept digitally generated image. - Powered by Shutterstock - Get 15% off with code: PIKWIZARD15

Credit Photo

If you would like to credit the Photo, here are some ways you can do so

Free (free of charge)

Free for personal and commercial use.

Author: Awesome Content

Similar Free Stock Images

Close-Up of Colored Pencils Arranged in Circular Pattern
Premium
Displaying multicolored candlestick and dotted trend charts on trading dashboard, with world map. Finance, analytics, technology, dashboard, data, investment, digital
Colorful Puzzle Pieces Falling Against White Background
Various Pastel Puzzle Pieces on White Background
Chalkboard Mathematics Concepts on Gradient Background
Handwritten Mathematical Formulae on Colorful Gradient Background
Premium
Image of financial data processing over solar panels. global business, finances and digital interface concept digitally generated image.
Economy and Finance Analytics on Benin Flag Background
Colorful Speedometer Display on Black Background
Close-Up of Multicolored Pencils for Creativity and Education
Digital Financial Display with Graphs and Data Analysis
Premium
Image of statistics and financial data processing over grid. Global business finances connections and digital interface concept digitally generated image.
Vibrant Polygonal Abstract Background with Rainbow Colors
Vibrant Concentric Circles with Rainbow Spectrum
Abstract Financial Graph with Rising Waves on Red Gradient
Colorful Array of Sharp Pencils Lined on Wooden Surface
Premium
Image of changing numbers and financial data processing against office desk. Global finance and business technology concept
Row of Colored Pencils on White Background with Copy Space
Close-Up of Colorful Pencils on White Background for Art Projects
Colorful Spectrum of Pencils for Creativity and Organization
Vibrant Circular Arrangement of Multicolored Pencils on White Background
Premium
Image of blue graph and data processing over 3d grid. Global communication, business, finance and data interface concept digitally generated image.
Data Analytics Graphs on Digital Interface Background
Colorful Puzzle Pieces with Dynamic Floating Elements
Abstract Financial Data Analytics on Dark Grid Background
Financial Data Processing with Graphs and Charts Overlay
Premium
Image of blue charts processing data and energy icons over cityscape. Data, digital interface, connection, processing, finance, business and communication, digitally generated image.
Abstract Digital Data Graph and Diagrams on Gray Background
Abstract Green Circular Diagram on Orange Gradient Background
Abstract Digital Interface with Data Bars on Gradient Background
Colorful Geometric Squares Creating Vibrant Abstract Design
Colorful Puzzle Pieces Symbolizing Autism Awareness
Geometric Abstract Colorful Digital Art Background
Premium
Image of charts over grid and cityscape. Business, data processing and digital interface concept digitally generated image.
Colorful Puzzle Pieces Falling Against White Backdrop
Handwritten Mathematical Formulas on Vibrant Gradient Background
Graphical Analysis on Russian Economy with Financial Metrics
Vibrant Rainbow Square Grid Pattern
Premium
Processing sleeved hands tapping payment card on reader in display with globe and binary code. Fintech, digital banking, e-commerce, technology, commerce, innovation, cybersecurity
Colorful Puzzle Pieces with Vibrant Paint Splashes Background
Vibrant Neon Rectangles on Black Abstract Background
Black Background with Grid Pattern for Digital Design
Vibrant Abstract Gradient Artwork
Premium
Image of blue and pale blue stock market data rolling and processing over a grid. Global economy stock market concept digital composition
Vintage Microphone with Colorful Bokeh Lights
Multicolor TV Color Bars Signal Interference Concept
Heart-Shaped Colored Pencils Creative Arrangement on White Background
Vibrant Colored Pencils on Lined Paper for Creative Expression
Premium
Image of financial data processing over aerial view of sea waves. Global finance and business technology concept
Colored Pencils Close-Up with Blurred Artistic Effect
Colorful Pencils Arranged in Semi-Circle on White Space
Vibrant Close-Up of Multicolored Pencils on White Background
Abstract Digital Interface with Network Connections and Data Visualizations
Premium
Forex concept : Candlestick chart red green in financial market for trading on black color background
Falling Business Graph on Green Digital Background
Colorful Puzzle Theme Signifying Cancer Survivors
Dynamic Lines Show Rising Financial Statistics Over Time
Digital Data Stream on Dynamic Red-Green Gradient
Premium
Image of blue chart processing data and energy icons over cityscape. Data, digital interface, connection, processing, finance, business and communication, digitally generated image.
Dynamic Interplay of Vibrant Overlapping Circles on Dark Background
Colorful Pencils on Blue Background with Blank Space
Futuristic Glowing Triangle in Digital Space with Binary Code
Multicolored Puzzle Pieces Forming Autism Awareness Symbol
Dynamic Moving Colorful Geometric Shapes Overlay
Vibrant Floating Puzzle Pieces Symbolizing Creativity
Premium
Image of financial data processing over grid. Global finance, business, connections, computing and data processing concept digitally generated image.
Mathematical Formulae on Vibrant Gradient Backdrop
Vibrant Geometric Design with Colorful Pie Chart
Economic and Political Factors Influence Investment Trends
Colorful Digital Car Speedometer on Black Background
Premium
Image of statistics and financial data processing over grid. Global finance, business, connections, computing and data processing concept digitally generated image.
Vibrant Colored Pencils on Light Blue Background
Vibrant Digital Rainbow Stripes Celebrating LGBTQ Pride
Vibrant Abstract Gradient Background with Linear Pattern
Colorful Abstract Circles on a Vibrant Rainbow Background
Premium
Image of charts and data processing over 3d grid. Global communication, business, finance and data interface concept digitally generated image.
Assorted Colored Pencils on Wooden Table Surface
Organized Colored Pencils Displayed in Gradient Pattern on White Background
Colorful Pencils Arranged on White Grid Background
Colorful Pencils Aligned Creatively on White Surface
Premium
Image of blue graph and data processing on 3d grid over buildings in modern cityscape. Development, communication, finance and data interface concept digitally generated image.
Colorful Pencils Aligning Creativity Against White Backdrop
Vivid Red to Emerald Gradient for Sprucing Design Projects
AI Chatbot Explaining HTML to Professional Working on Laptop
Colorful Creativity with Vibrant Crayons
Premium
Image of graphs over timelapse with zebra crossing. Global network, connections, communication, data processing, finance and technology concept digitally generated image.
Financial Data Analytics Over Equatorial Guinea Flag
Dynamic Green Line Graph Depicting Financial Data
Abstract Data Visualization Digital Chart Background
Dynamic Financial Data Analysis with Growth Indicators
Premium
Image of financial data processing and statistics recording over grid and cityscape in the background. Global business and finances concept digitally generated image.
Colorful Puzzle Pieces Symbolizing Unity and Inclusion
Futuristic Data Visualization with Radar Dashboard and Code Snippets
Colorful Illustration Celebrating Substitution Day
Colorful Pencils and School Supplies for Education Themes
Floating Pastel Puzzle Pieces Over White Background
Colorful Puzzle Pieces Falling on White Background
Premium
Stirring metal arm mixing roasted coffee beans in roasting tray, with financial graph overlays. Coffee, roasting, analytics, industrial, commodity, brew, technology
Graph Showing Ukraine Economic Crisis Indicators
Colombia Flag And Financial Analytics Integration
Colorful Car Speedometer Illustration on Black Background
Celebratory Confetti with LGBTQ Pride Flags and Colors
Premium
Financial data processing against mid section of a man using smartphone. Global finance and business technology concept
Vibrant Abstract Gradient in Red and Green Hues
Colorful Computer Monitor with Blank Screen and Digital Background
Colorful Overlapping Circles on Dynamic Rainbow Background
Digital Financial Data with Graph and Grid Patterns
Premium
Image of financial data processing over solar panel. global business, finances and digital interface concept digitally generated image.
Colorful Pencils Forming Heart Shape Symbolizing Artistic Passion
Colorful Pencils in Rows on Graph Paper for Art and Education
Colorful Pencils on White Background for Creative Projects
Vibrant Gradient of Colored Pencils on White Background
Premium
Image of financial data processing over cityscape and full moon. Global business, finances, computing and data processing concept digitally generated image.
Colorful Pencils Arranged Against Vibrant Abstract Background
Economic Data Analysis Graph over Gabon Flag Background
Abstract Digital Finance Chart Showing Fluctuating Graph Lines
Interactive Business Graph with Currency Data and Analytics
Premium
Image of blue charts processing data and energy icons over cityscape. Data, digital interface, connection, processing, finance, business and communication, digitally generated image.
Colorful Pencils Lined Up on White Background
Dynamic Financial Data Chart on Green Gradient Background
Dynamic Financial Stock Market Analysis Display
Vibrant Geometric Circles and Lines on Black Background
Premium
Image of financial data processing over grid and planet Earth in the background. Global business finances networking concept digitally generated image.
Vibrant Colored Pencils Cluster Standing Upright with Minimal Chart Overlay and Copy Space