- Home >
- Stock Photos >
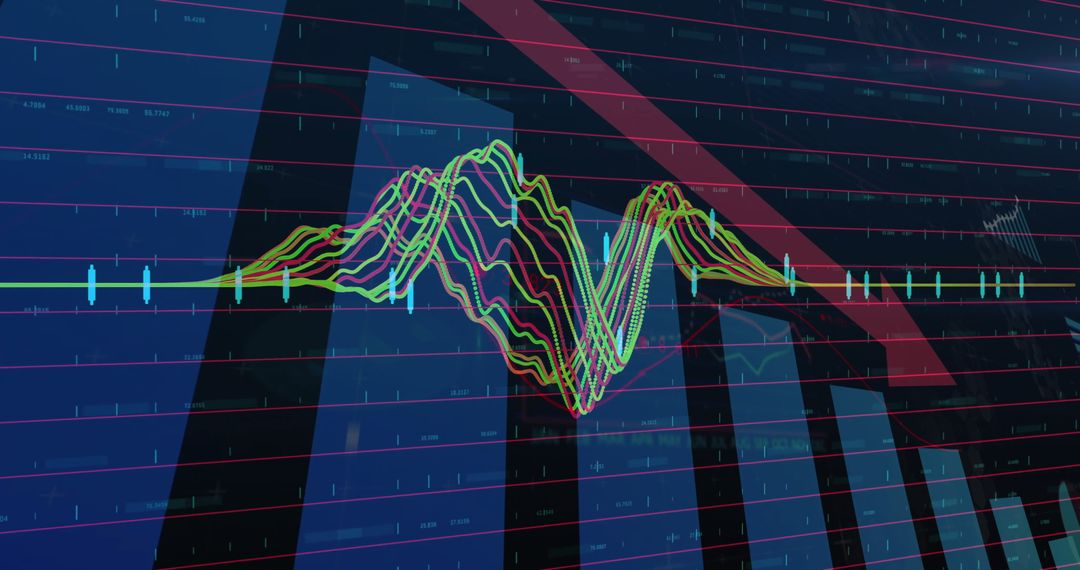
- Colorful Financial Data Display with Trend Lines and Graphs
Colorful Financial Data Display with Trend Lines and Graphs Image

Vivid representation of financial data with red trend line, green zigzag arrows, and blue reference line suggests dynamic market analysis. Suitable for illustrating investment strategies, financial presentations, stock market analysis, and technology concepts. Ideal for use in presentations, financial blog posts, online courses, and economic news features.
Powered by  - Get 15% off with code: PIKWIZARD15


0
downloads
downloads
Tags:
More
Credit Photo
If you would like to credit the Photo, here are some ways you can do so
Text Link
photo Link
<span class="text-link">
<span>
<a target="_blank" href=https://pikwizard.com/photo/colorful-financial-data-display-with-trend-lines-and-graphs/9d978b3af7dcb7d8fe83c5e2dc1ac999/>PikWizard</a>
</span>
</span>
<span class="image-link">
<span
style="margin: 0 0 20px 0; display: inline-block; vertical-align: middle; width: 100%;"
>
<a
target="_blank"
href="https://pikwizard.com/photo/colorful-financial-data-display-with-trend-lines-and-graphs/9d978b3af7dcb7d8fe83c5e2dc1ac999/"
style="text-decoration: none; font-size: 10px; margin: 0;"
>
<img src="https://pikwizard.com/pw/medium/9d978b3af7dcb7d8fe83c5e2dc1ac999.jpg" style="margin: 0; width: 100%;" alt="" />
<p style="font-size: 12px; margin: 0;">PikWizard</p>
</a>
</span>
</span>
Free (free of charge)
Free for personal and commercial use.
Author: Authentic Images
Similar Free Stock Images

Premium


Premium


Premium


Premium


Premium


Premium


Premium


Premium


Premium


Premium


Premium


Premium


Premium


Premium


Premium


Premium


Premium


Premium


Premium


Premium


Premium


Premium


Premium


Premium