
- Home >
- Stock Photos >
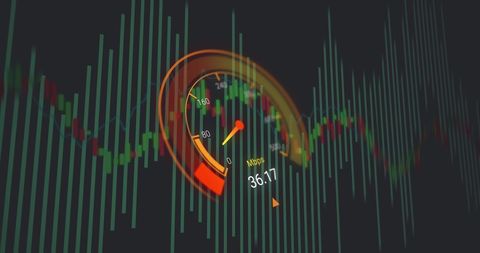
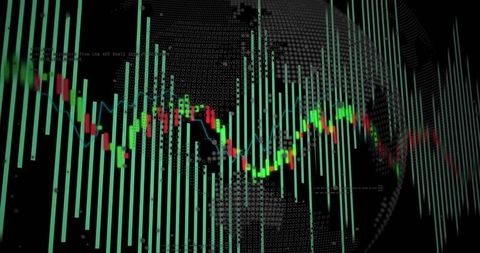
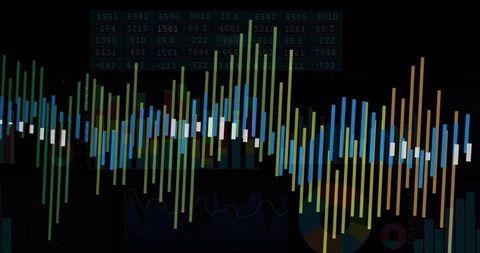
- Colorful Financial Data Graph on Dark Interface
Colorful Financial Data Graph on Dark Interface Image
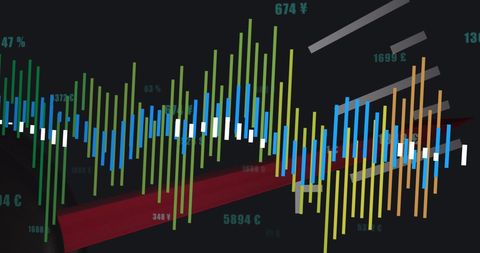
Vibrant bars represent financial data analysis. Great for illustrating advanced technology and data processing in finance or economy-related content. Ideal for presentations on global business trends and innovative business solutions, it emphasizes the role of technology in modern finance.
Powered by 


downloads
Tags:
More
Credit Photo
If you would like to credit the Photo, here are some ways you can do so
Text Link
photo Link
<span class="text-link">
<span>
<a target="_blank" href=https://pikwizard.com/photo/colorful-financial-data-graph-on-dark-interface/4a330f1613e2e41faa847cd7b5aff894/>PikWizard</a>
</span>
</span>
<span class="image-link">
<span
style="margin: 0 0 20px 0; display: inline-block; vertical-align: middle; width: 100%;"
>
<a
target="_blank"
href="https://pikwizard.com/photo/colorful-financial-data-graph-on-dark-interface/4a330f1613e2e41faa847cd7b5aff894/"
style="text-decoration: none; font-size: 10px; margin: 0;"
>
<img src="https://pikwizard.com/pw/medium/4a330f1613e2e41faa847cd7b5aff894.jpg" style="margin: 0; width: 100%;" alt="" />
<p style="font-size: 12px; margin: 0;">PikWizard</p>
</a>
</span>
</span>
Free (free of charge)
Free for personal and commercial use.
Author: Awesome Content
Similar Free Stock Images
Premium


Premium


Premium

Premium


Premium


AI


Premium


Premium


Premium

Premium

Premium


Premium


Premium

Premium


Premium


Premium


Premium


Premium

Premium


Premium


Premium

Premium


AI

Premium


Premium


Premium


Premium


Explore More Free Stock Images