
- Home >
- Stock Photos >
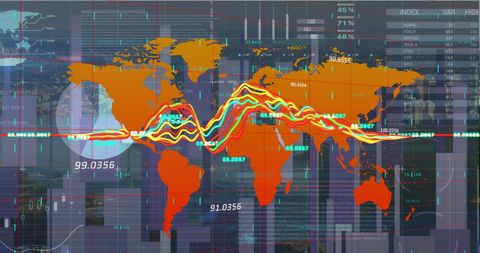
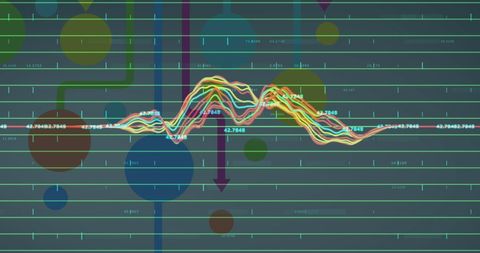
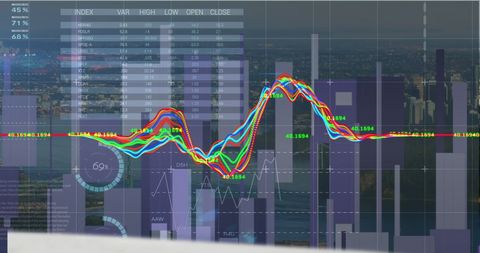
- Colorful Financial Data Processing on Digital Screen
Colorful Financial Data Processing on Digital Screen Image

Colorful lines and graphs representing financial data processing displayed on a digital screen. A modern representation of statistical analysis over a grid network against a blue background. Ideal for use in materials focused on business technology, data visualization, and market trends. Suitable for finance and investment presentations, technology blogs, and corporate analysis reports.
Powered by  - Get 15% off with code: PIKWIZARD15


downloads
Tags:
More
Credit Photo
If you would like to credit the Photo, here are some ways you can do so
Text Link
photo Link
<span class="text-link">
<span>
<a target="_blank" href=https://pikwizard.com/photo/colorful-financial-data-processing-on-digital-screen/7d8882938d0dc15620bdc9eec9ae14f5/>PikWizard</a>
</span>
</span>
<span class="image-link">
<span
style="margin: 0 0 20px 0; display: inline-block; vertical-align: middle; width: 100%;"
>
<a
target="_blank"
href="https://pikwizard.com/photo/colorful-financial-data-processing-on-digital-screen/7d8882938d0dc15620bdc9eec9ae14f5/"
style="text-decoration: none; font-size: 10px; margin: 0;"
>
<img src="https://pikwizard.com/pw/medium/7d8882938d0dc15620bdc9eec9ae14f5.jpg" style="margin: 0; width: 100%;" alt="" />
<p style="font-size: 12px; margin: 0;">PikWizard</p>
</a>
</span>
</span>
Free (free of charge)
Free for personal and commercial use.
Author: People Creations
Similar Free Stock Images

Premium


Premium


Premium


Premium


Premium

Premium

Premium

Premium


Premium


Premium


Premium

Premium

Premium


Premium


Premium


Premium


Premium

Premium


Premium


Premium


Premium


Premium

Premium


Premium


Premium


Explore More Free Stock Images