- Home >
- Stock Photos >
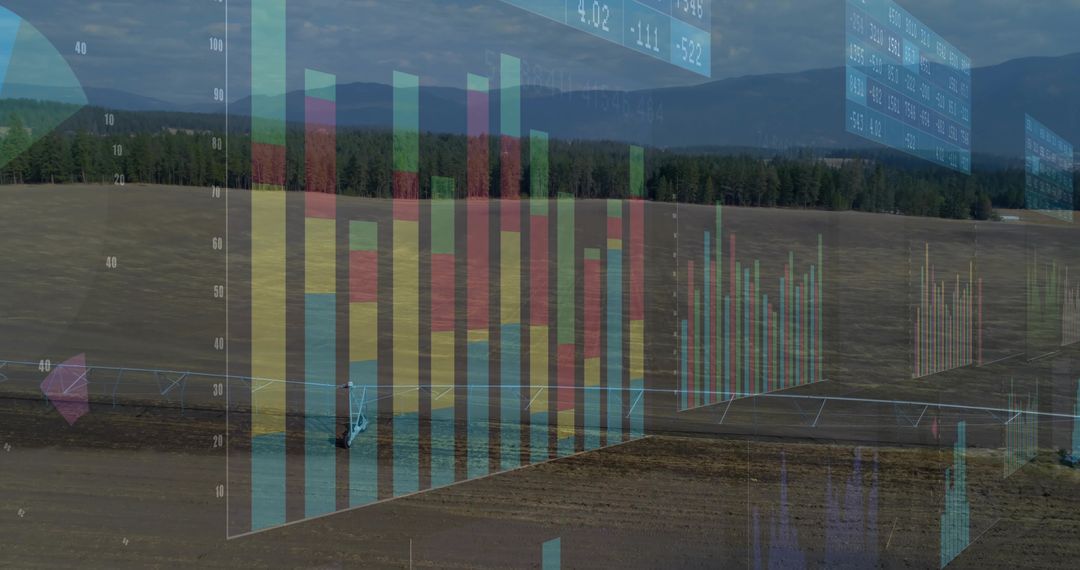
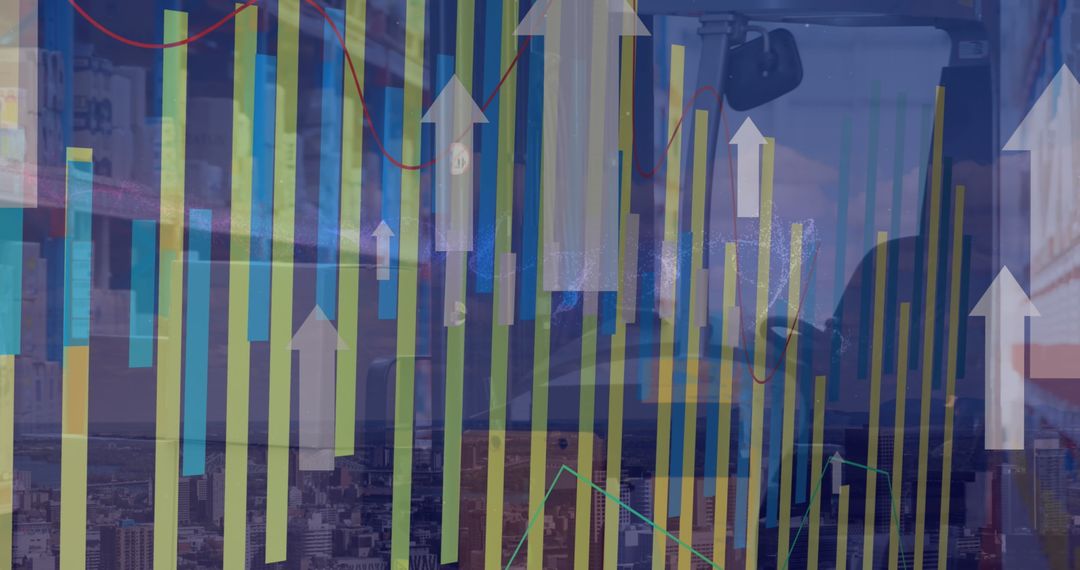
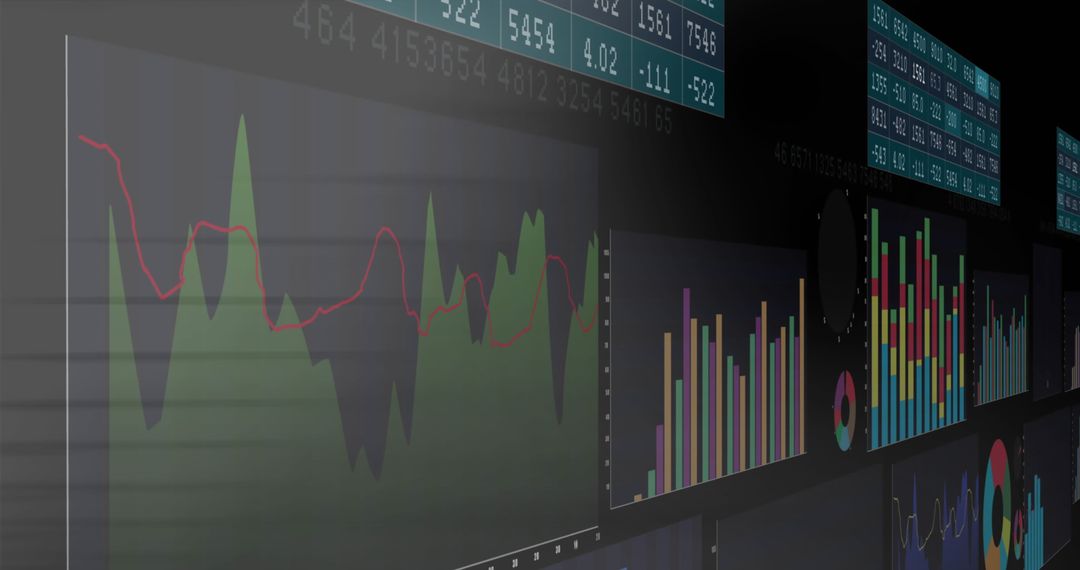
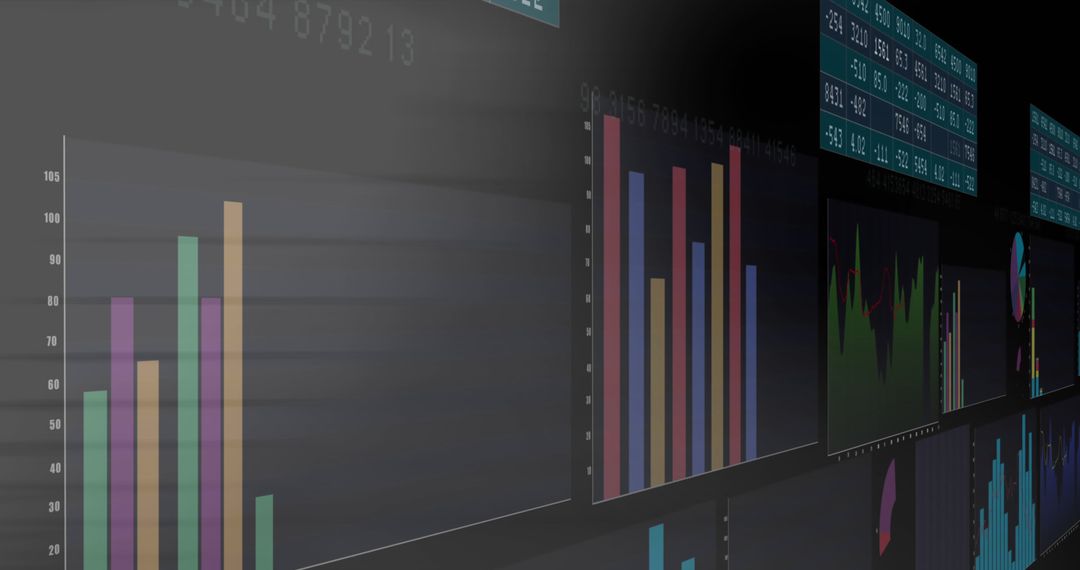
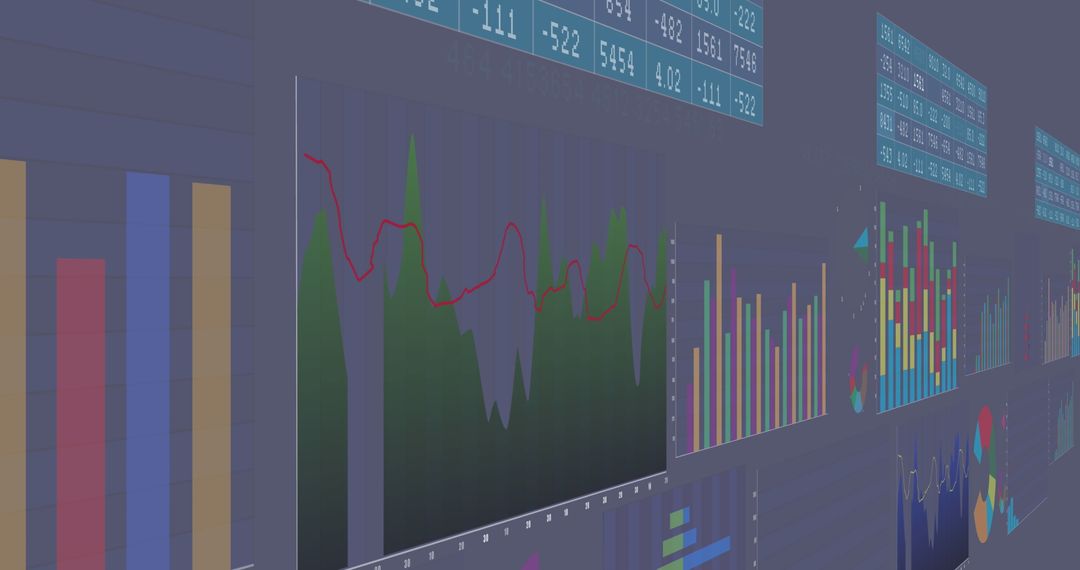
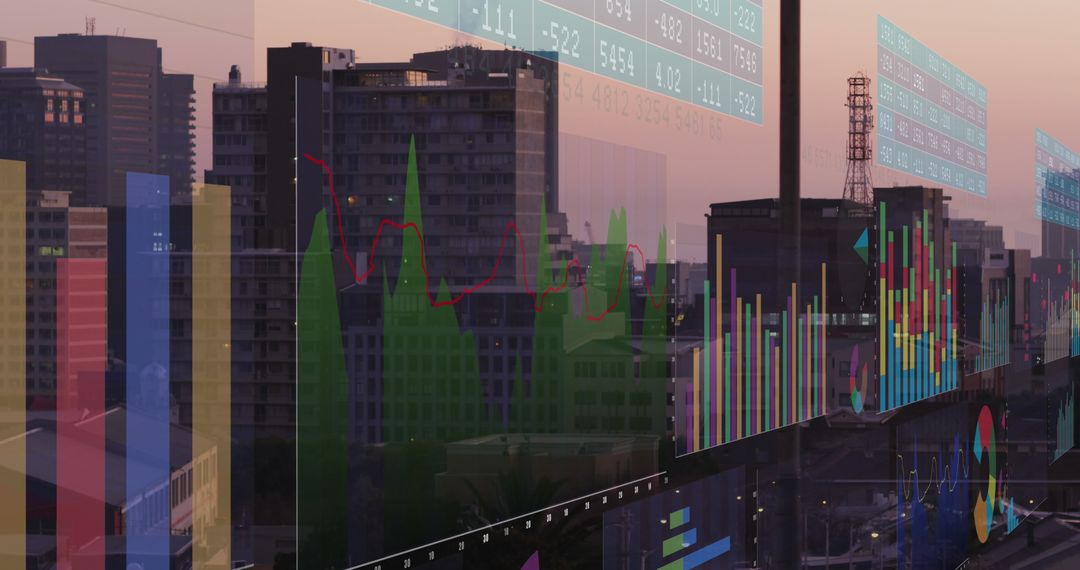
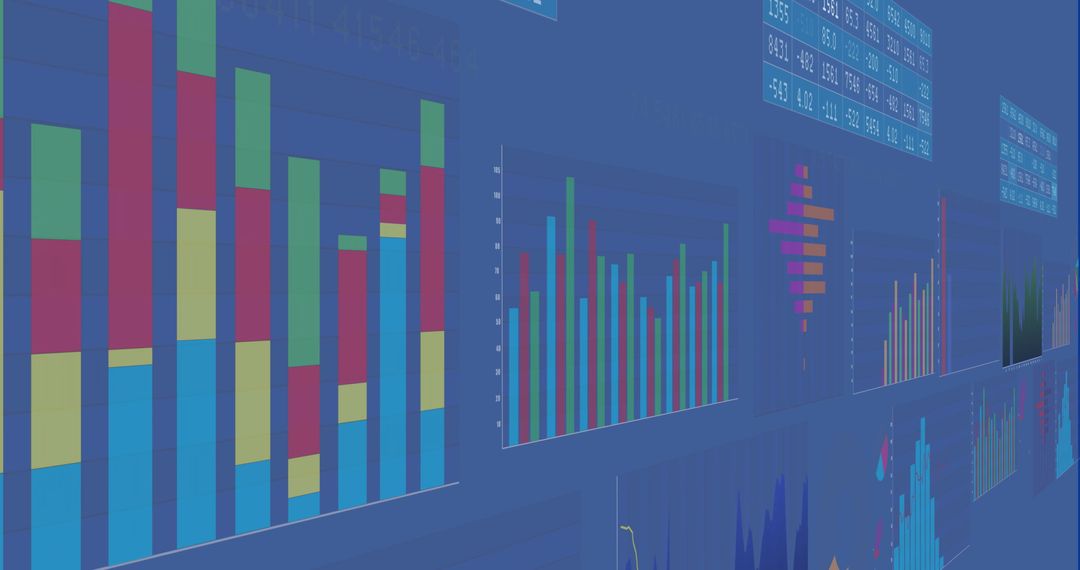
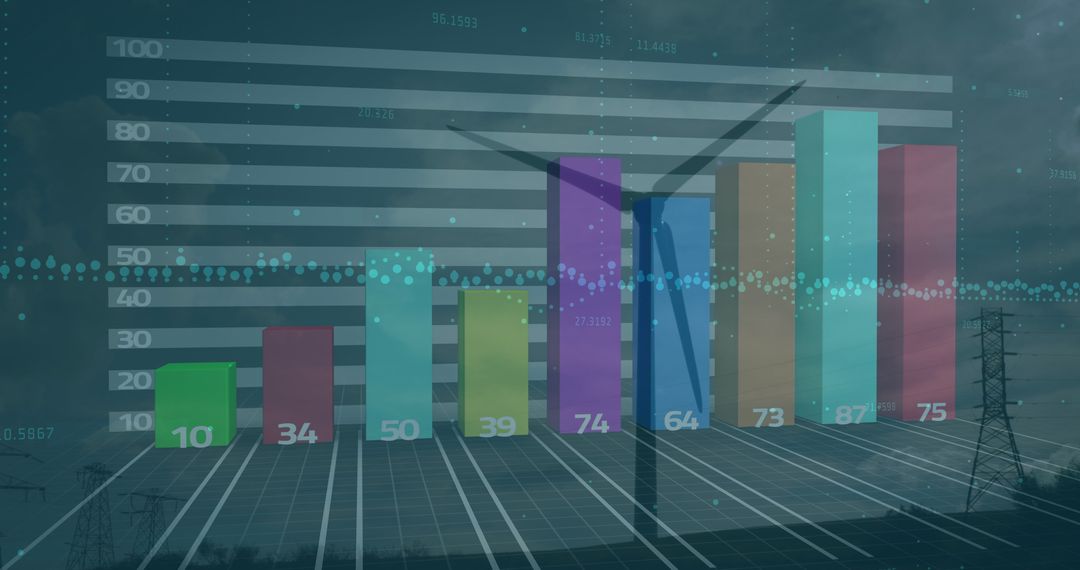
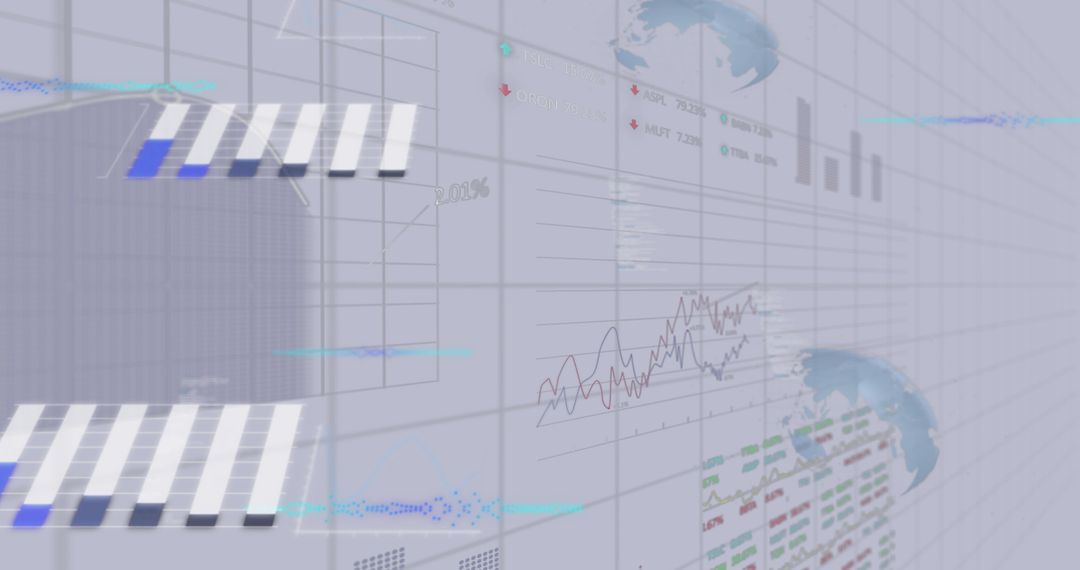
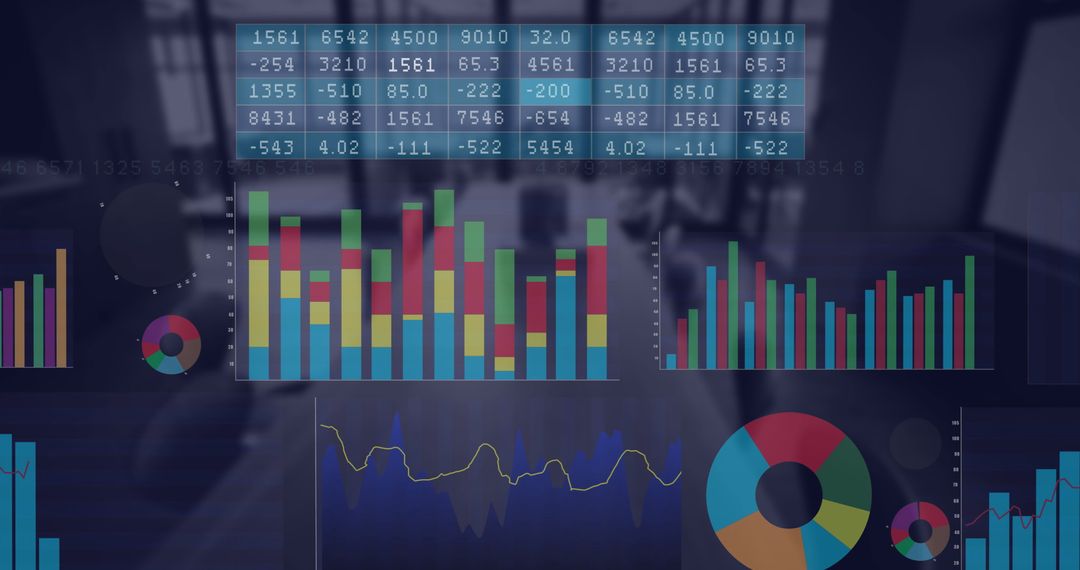
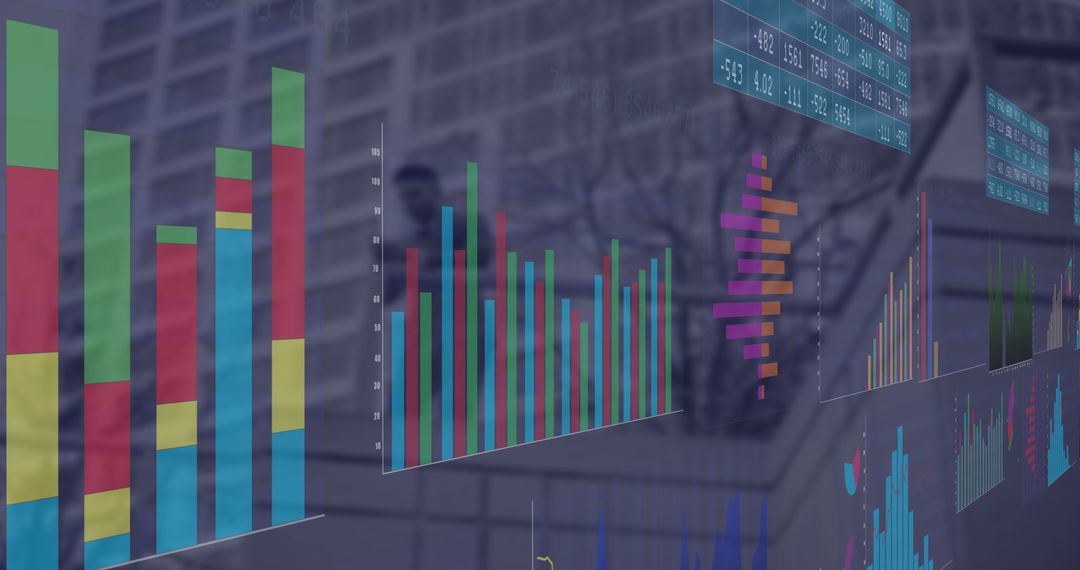
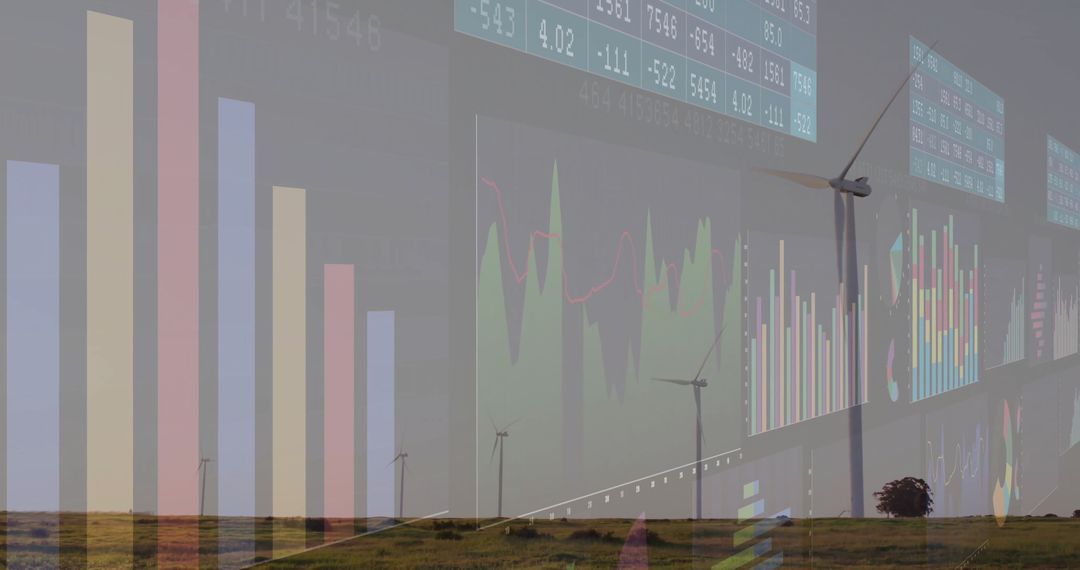
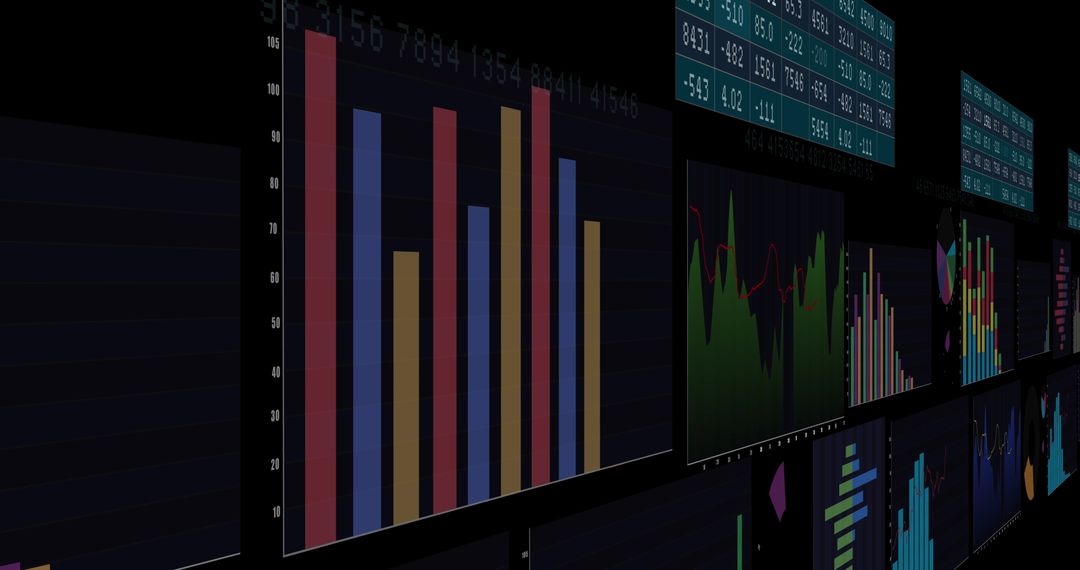
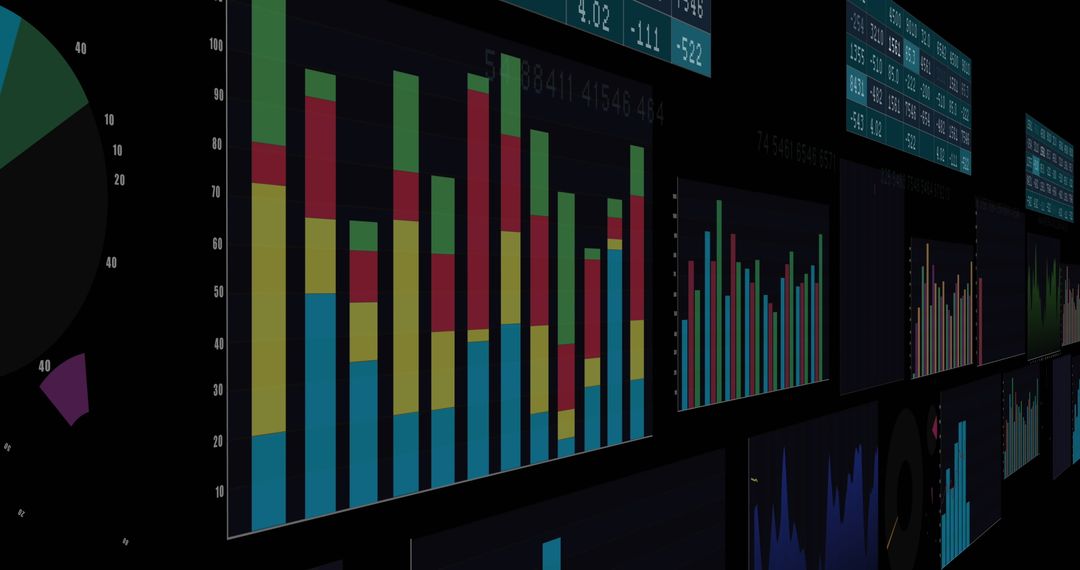
- Colorful Financial Data Trends on Multiple Screens
Colorful Financial Data Trends on Multiple Screens Image
Dynamic representation of financial data through colorful graphs and charts on multiple digital screens. Ideal for illustrating complex data analysis, financial reports, and economic trends. Suitable for business, finance, technology publications, and presentations aiming to convey visual analytics in professional settings.
Powered by 


10
downloads
downloads
Tags:
More
Credit Photo
If you would like to credit the Photo, here are some ways you can do so
Text Link
photo Link
<span class="text-link">
<span>
<a target="_blank" href=https://pikwizard.com/photo/colorful-financial-data-trends-on-multiple-screens/c2711255abcb37668a6d86d90d942e71/>PikWizard</a>
</span>
</span>
<span class="image-link">
<span
style="margin: 0 0 20px 0; display: inline-block; vertical-align: middle; width: 100%;"
>
<a
target="_blank"
href="https://pikwizard.com/photo/colorful-financial-data-trends-on-multiple-screens/c2711255abcb37668a6d86d90d942e71/"
style="text-decoration: none; font-size: 10px; margin: 0;"
>
<img src="https://pikwizard.com/pw/medium/c2711255abcb37668a6d86d90d942e71.jpg" style="margin: 0; width: 100%;" alt="" />
<p style="font-size: 12px; margin: 0;">PikWizard</p>
</a>
</span>
</span>
Free (free of charge)
Free for personal and commercial use.
Author: Awesome Content
Similar Free Stock Images

Premium


Premium


Premium


Premium


Premium


Premium


Premium


Premium


Premium


Premium


Premium


Premium


Premium


Premium


Premium


Premium


Premium


Premium


Premium


Premium


Premium


Premium


Premium


Premium