
- Home >
- Stock Photos >
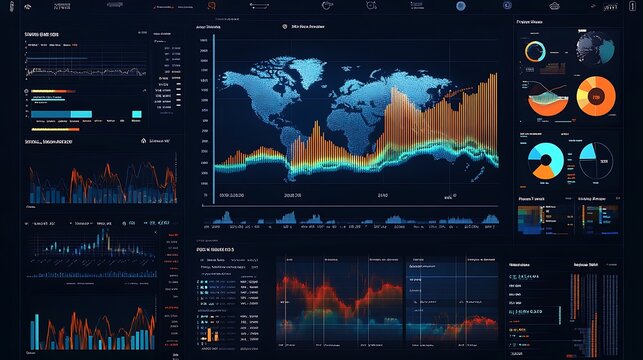
- Colorful Financial Data Visualization on Dark Grid
Colorful Financial Data Visualization on Dark Grid Image

Dynamic visual of fluctuating financial data tracing across striking dark grid. Colorful lines symbolize vibrant analysis in global finance, resonating concepts of algorithms in trading markets. Ideal for illustrating articles on financial technology advancements, presentations on business forecasting techniques, or any creative project emphasizing economic connectivity globally.
Powered by 


downloads
Tags:
More
Credit Photo
If you would like to credit the Photo, here are some ways you can do so
Text Link
photo Link
<span class="text-link">
<span>
<a target="_blank" href=https://pikwizard.com/photo/colorful-financial-data-visualization-on-dark-grid/39dc9b095d90d29ee2505f458ed4e9e0/>PikWizard</a>
</span>
</span>
<span class="image-link">
<span
style="margin: 0 0 20px 0; display: inline-block; vertical-align: middle; width: 100%;"
>
<a
target="_blank"
href="https://pikwizard.com/photo/colorful-financial-data-visualization-on-dark-grid/39dc9b095d90d29ee2505f458ed4e9e0/"
style="text-decoration: none; font-size: 10px; margin: 0;"
>
<img src="https://pikwizard.com/pw/medium/39dc9b095d90d29ee2505f458ed4e9e0.jpg" style="margin: 0; width: 100%;" alt="" />
<p style="font-size: 12px; margin: 0;">PikWizard</p>
</a>
</span>
</span>
Free (free of charge)
Free for personal and commercial use.
Author: People Creations
Similar Free Stock Images

Premium


Premium

Premium


Premium

Premium


Premium


Premium


Premium


Premium


Premium


Premium


Premium


Premium


Premium

Premium

Premium


Premium

Premium


Premium

Premium


Premium


Premium


Premium


Premium


Premium


Explore More Free Stock Images