
- Home >
- Stock Photos >
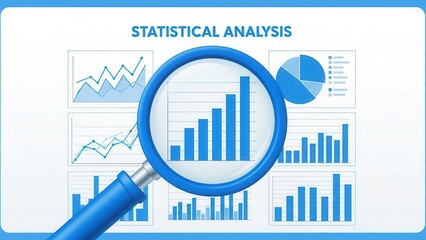
- Colorful Financial Data Visualization with Statistical Graphs
Colorful Financial Data Visualization with Statistical Graphs Image

Visualization of financial data featuring vibrant colored lines and graphs. Ideal for illustrating global business concepts, data analytics in finance, or digital economic reports. Perfect for presentations, financial articles, and business proposals.
Powered by 


downloads
Tags:
More
Credit Photo
If you would like to credit the Photo, here are some ways you can do so
Text Link
photo Link
<span class="text-link">
<span>
<a target="_blank" href=https://pikwizard.com/photo/colorful-financial-data-visualization-with-statistical-graphs/1e11de4e714814581e89b06b7d8e9a3b/>PikWizard</a>
</span>
</span>
<span class="image-link">
<span
style="margin: 0 0 20px 0; display: inline-block; vertical-align: middle; width: 100%;"
>
<a
target="_blank"
href="https://pikwizard.com/photo/colorful-financial-data-visualization-with-statistical-graphs/1e11de4e714814581e89b06b7d8e9a3b/"
style="text-decoration: none; font-size: 10px; margin: 0;"
>
<img src="https://pikwizard.com/pw/medium/1e11de4e714814581e89b06b7d8e9a3b.jpg" style="margin: 0; width: 100%;" alt="" />
<p style="font-size: 12px; margin: 0;">PikWizard</p>
</a>
</span>
</span>
Free (free of charge)
Free for personal and commercial use.
Author: Creative Art
Similar Free Stock Images

Premium

Premium


Premium


Premium


Premium


Premium


Premium

Premium

Premium


Premium


Premium


Premium


Premium


Premium


Premium


Premium


Premium


Premium


Premium


Premium

Premium


Premium


Premium


Premium


Premium


Explore More Free Stock Images