
- Home >
- Stock Photos >
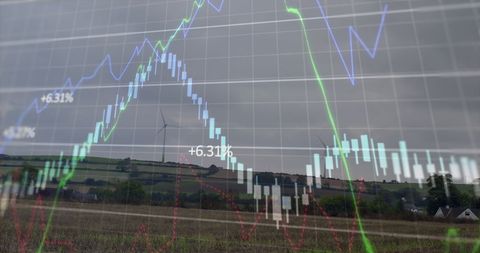
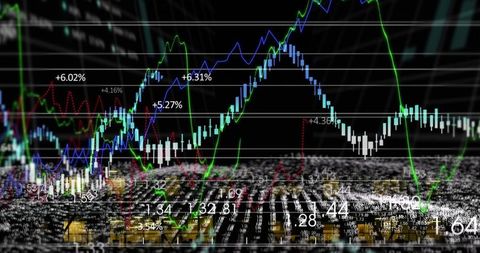
- Colorful Financial Graph Showing Market Volatility
Colorful Financial Graph Showing Market Volatility Image

Image depicting a vibrant and colorful financial graph illustrating market data. Red bars suggest declining metrics while lines denote fluctuating trends and values. Suitable for presentations related to economics, investments, market analysis, finance courses or business strategies. Ideal for articles addressing market volatility or financial risk assessment strategies.
Powered by  - Get 15% off with code: PIKWIZARD15


downloads
Tags:
More
Credit Photo
If you would like to credit the Photo, here are some ways you can do so
Text Link
photo Link
<span class="text-link">
<span>
<a target="_blank" href=https://pikwizard.com/photo/colorful-financial-graph-showing-market-volatility/7733517cdde532f996dbc3f8628bc945/>PikWizard</a>
</span>
</span>
<span class="image-link">
<span
style="margin: 0 0 20px 0; display: inline-block; vertical-align: middle; width: 100%;"
>
<a
target="_blank"
href="https://pikwizard.com/photo/colorful-financial-graph-showing-market-volatility/7733517cdde532f996dbc3f8628bc945/"
style="text-decoration: none; font-size: 10px; margin: 0;"
>
<img src="https://pikwizard.com/pw/medium/7733517cdde532f996dbc3f8628bc945.jpg" style="margin: 0; width: 100%;" alt="" />
<p style="font-size: 12px; margin: 0;">PikWizard</p>
</a>
</span>
</span>
Free (free of charge)
Free for personal and commercial use.
Author: People Creations
Similar Free Stock Images
Loading...

Premium


Premium

Premium


Premium


Premium


Premium


Premium


Premium


Premium

Premium

Premium


Premium


Premium

Premium

Premium

Premium


Premium


Premium


Premium


Premium


Premium

Premium

Premium


Premium

Premium


Explore More Free Stock Images