- Home >
- Stock Photos >
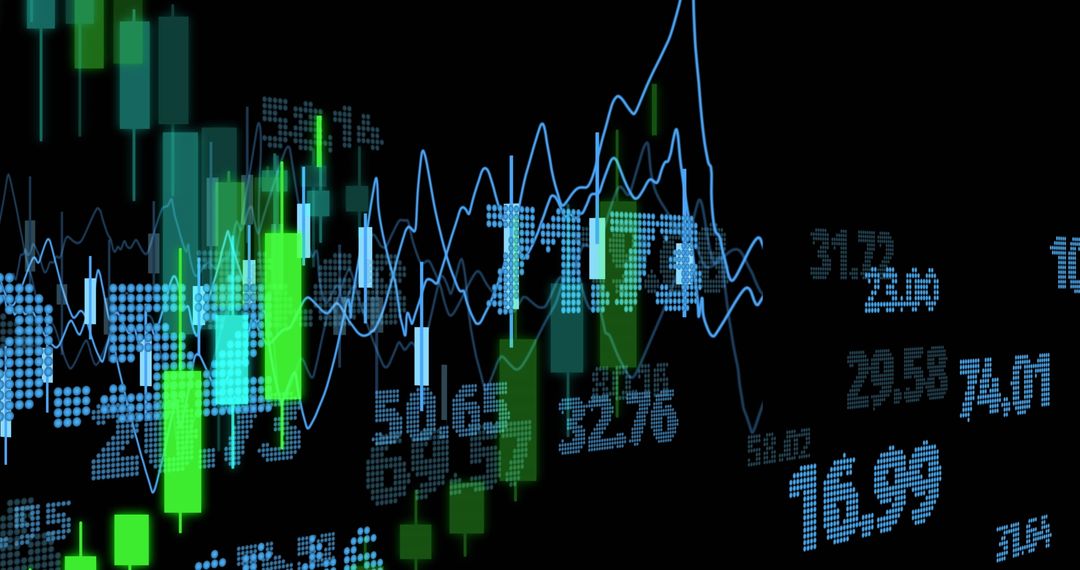
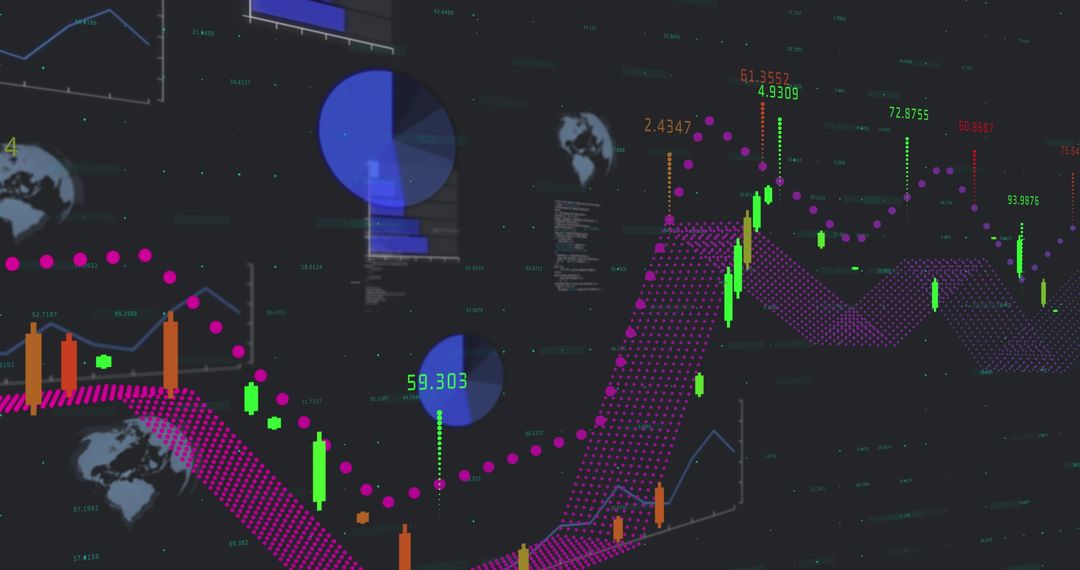
- Colorful Financial Graph with Global Map Display
Colorful Financial Graph with Global Map Display Image

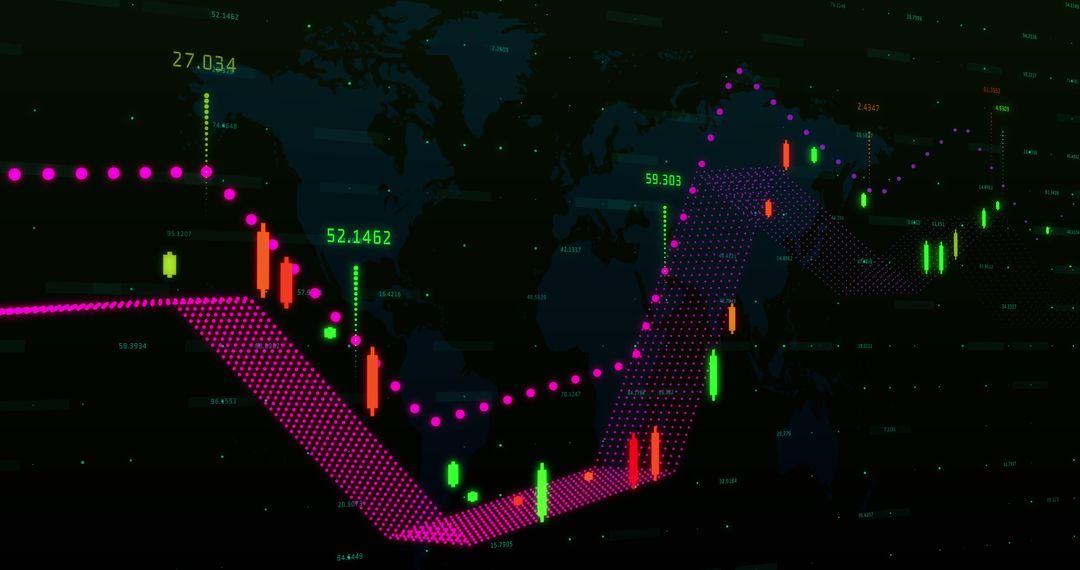
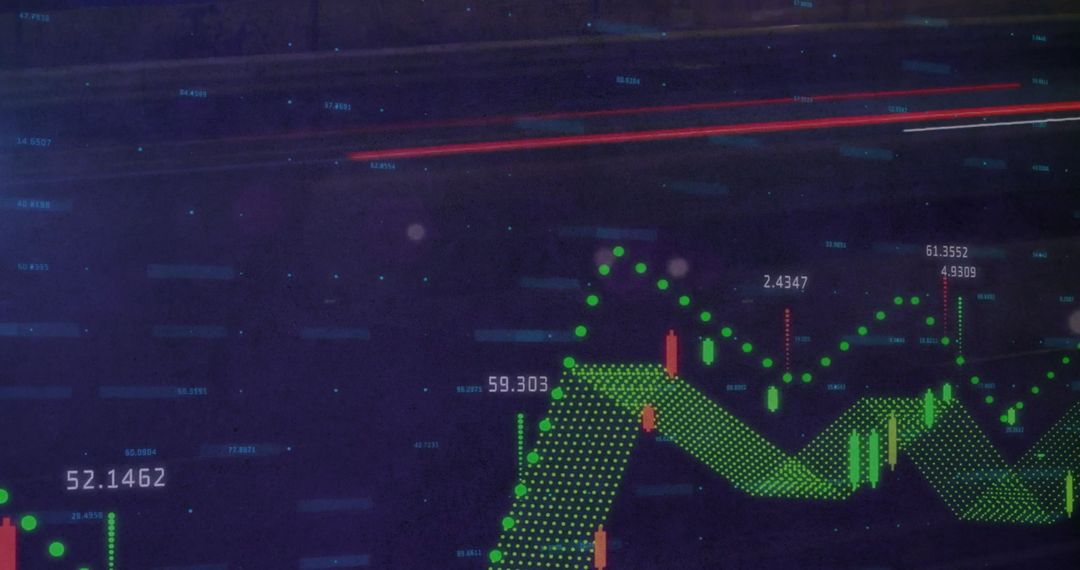
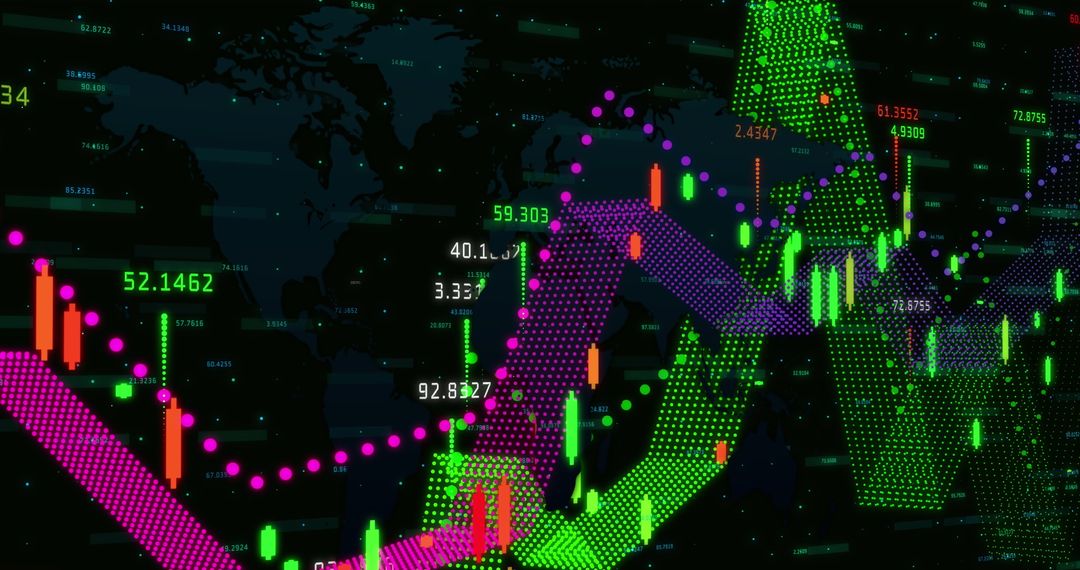
Colorful graph elements represent global financial trends against a subtle world map backdrop. Useful for illustrating concepts related to economic forecasts, investment strategies, or international markets in presentations, articles, or websites focusing on finance and global trade.
Powered by  - Get 15% off with code: PIKWIZARD15


2
downloads
downloads
Tags:
More
Credit Photo
If you would like to credit the Photo, here are some ways you can do so
Text Link
photo Link
<span class="text-link">
<span>
<a target="_blank" href=https://pikwizard.com/photo/colorful-financial-graph-with-global-map-display/d8fe48aa9d9d363fd01d037c1d74861a/>PikWizard</a>
</span>
</span>
<span class="image-link">
<span
style="margin: 0 0 20px 0; display: inline-block; vertical-align: middle; width: 100%;"
>
<a
target="_blank"
href="https://pikwizard.com/photo/colorful-financial-graph-with-global-map-display/d8fe48aa9d9d363fd01d037c1d74861a/"
style="text-decoration: none; font-size: 10px; margin: 0;"
>
<img src="https://pikwizard.com/pw/medium/d8fe48aa9d9d363fd01d037c1d74861a.jpg" style="margin: 0; width: 100%;" alt="" />
<p style="font-size: 12px; margin: 0;">PikWizard</p>
</a>
</span>
</span>
Free (free of charge)
Free for personal and commercial use.
Author: People Creations
Similar Free Stock Images

Premium


Premium


Premium


Premium


Premium


Premium


Premium


Premium


Premium


Premium


Premium


Premium


Premium


Premium


Premium


Premium


Premium


Premium


Premium


Premium


Premium


Premium


Premium


Premium