
- Home >
- Stock Photos >
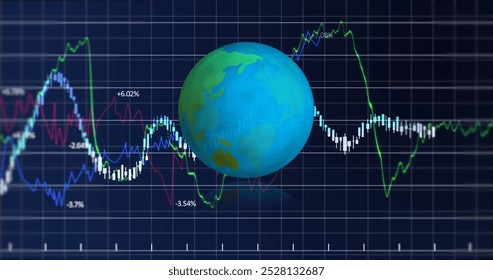
- Colorful Financial Graphs on Digital Grid Background
Colorful Financial Graphs on Digital Grid Background Image

Vibrant graphs displayed on a digital grid indicate trends and analyses in financial data processing. Suitable for presentations on the global market, financial forecasting, business intelligence, and data visualization tools. Ideal visual for reports on economic growth, fluctuations, and technology's role in finance.
Powered by  - Get 15% off with code: PIKWIZARD15


0
downloads
downloads
Tags:
More
Credit Photo
If you would like to credit the Photo, here are some ways you can do so
Text Link
photo Link
<span class="text-link">
<span>
<a target="_blank" href=https://pikwizard.com/photo/colorful-financial-graphs-on-digital-grid-background/8b38a77b271e4b25c5d39da7996eccf2/>PikWizard</a>
</span>
</span>
<span class="image-link">
<span
style="margin: 0 0 20px 0; display: inline-block; vertical-align: middle; width: 100%;"
>
<a
target="_blank"
href="https://pikwizard.com/photo/colorful-financial-graphs-on-digital-grid-background/8b38a77b271e4b25c5d39da7996eccf2/"
style="text-decoration: none; font-size: 10px; margin: 0;"
>
<img src="https://pikwizard.com/pw/medium/8b38a77b271e4b25c5d39da7996eccf2.jpg" style="margin: 0; width: 100%;" alt="" />
<p style="font-size: 12px; margin: 0;">PikWizard</p>
</a>
</span>
</span>
Free (free of charge)
Free for personal and commercial use.
Author: Creative Art
Similar Free Stock Images

Premium


Premium


Premium


Premium


Premium


Premium


Premium


Premium


Premium


Premium


Premium


Premium


Premium


Premium


Premium


Premium


Premium


Premium


Premium


Premium


Premium


Premium


Premium


Premium

