
- Home >
- Stock Photos >
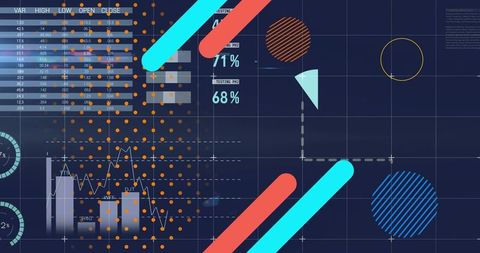
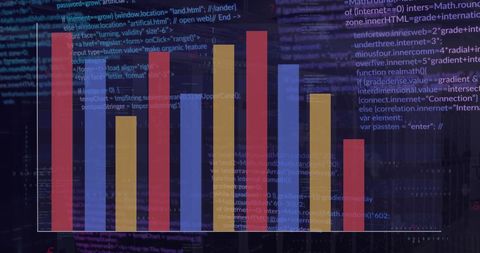
- Colorful Graph with Data Processing Interface Overlay
Colorful Graph with Data Processing Interface Overlay Image

Colorful bar graph overlaid on digital interface with charts and data processing elements is indicative of modern analytics and data visualization. Suitable for use in finance seminars, digital presentations, and articles on technology advancements and global communication strategies.
Powered by  - Get 15% off with code: PIKWIZARD15


downloads
Tags:
More
Credit Photo
If you would like to credit the Photo, here are some ways you can do so
Text Link
photo Link
<span class="text-link">
<span>
<a target="_blank" href=https://pikwizard.com/photo/colorful-graph-with-data-processing-interface-overlay/1bafba9d6a387bc76261f7d05cc78f3c/>PikWizard</a>
</span>
</span>
<span class="image-link">
<span
style="margin: 0 0 20px 0; display: inline-block; vertical-align: middle; width: 100%;"
>
<a
target="_blank"
href="https://pikwizard.com/photo/colorful-graph-with-data-processing-interface-overlay/1bafba9d6a387bc76261f7d05cc78f3c/"
style="text-decoration: none; font-size: 10px; margin: 0;"
>
<img src="https://pikwizard.com/pw/medium/1bafba9d6a387bc76261f7d05cc78f3c.jpg" style="margin: 0; width: 100%;" alt="" />
<p style="font-size: 12px; margin: 0;">PikWizard</p>
</a>
</span>
</span>
Free (free of charge)
Free for personal and commercial use.
Author: People Creations
Similar Free Stock Images

Premium


Premium

Premium


Premium


Premium


Premium


Premium


Premium


Premium

Premium

Premium


Premium


Premium


Premium


Premium


Premium


Premium


Premium


Premium


Premium


Premium


Premium


Premium


Premium


Premium

Explore More Free Stock Images