- Home >
- Stock Photos >
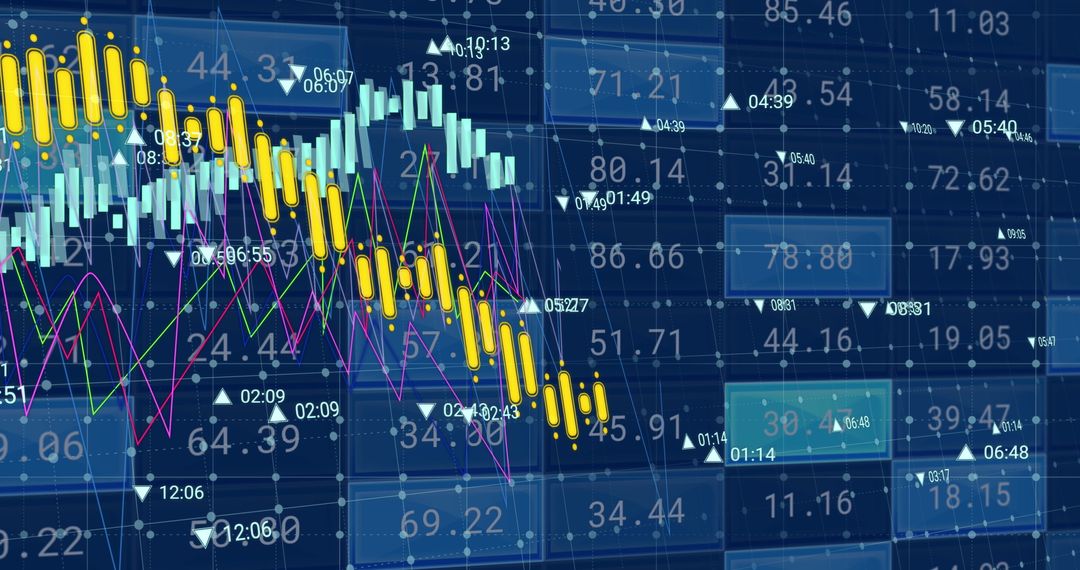
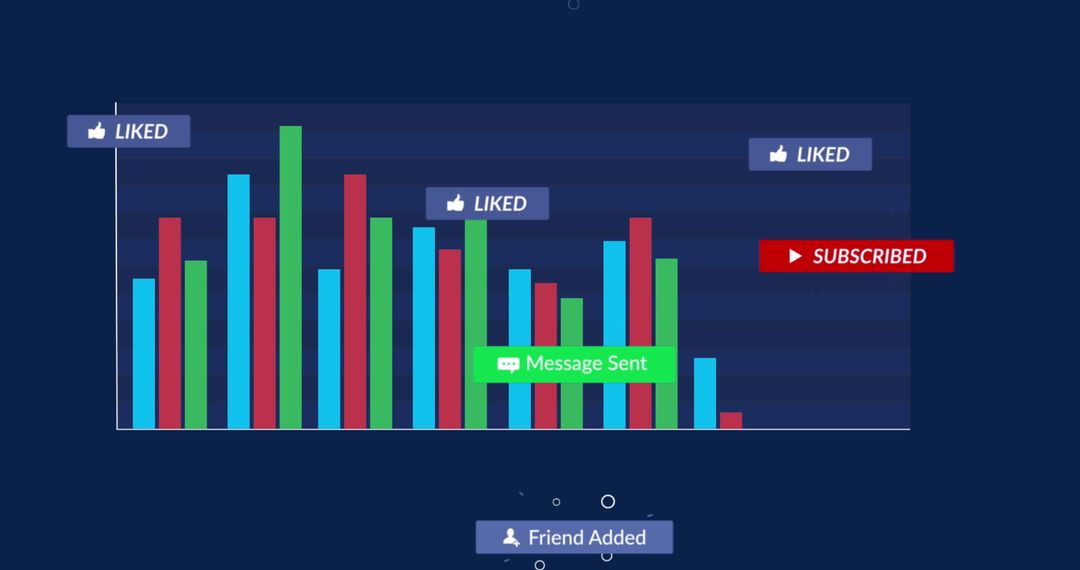
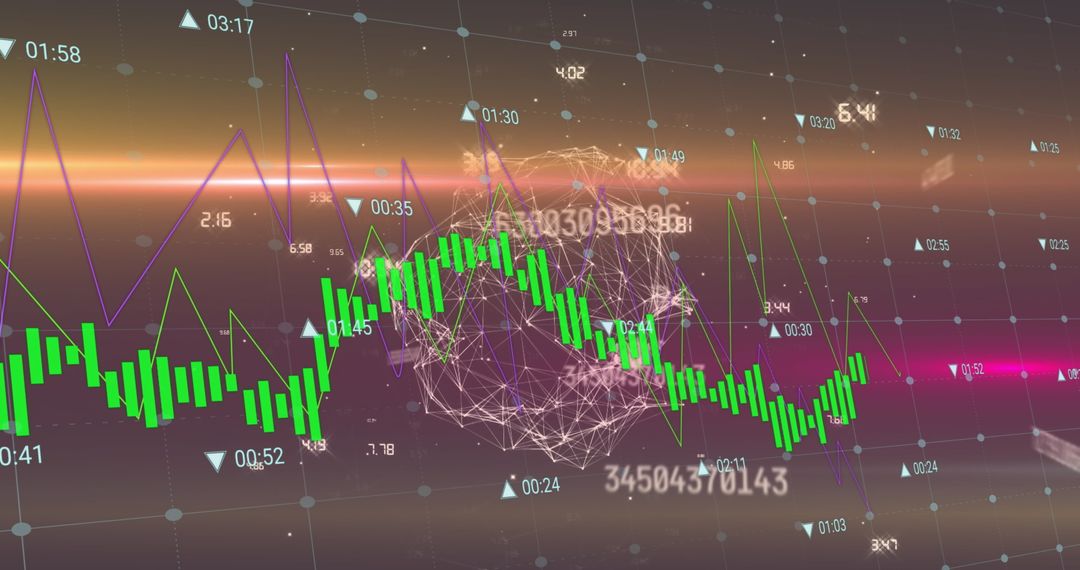
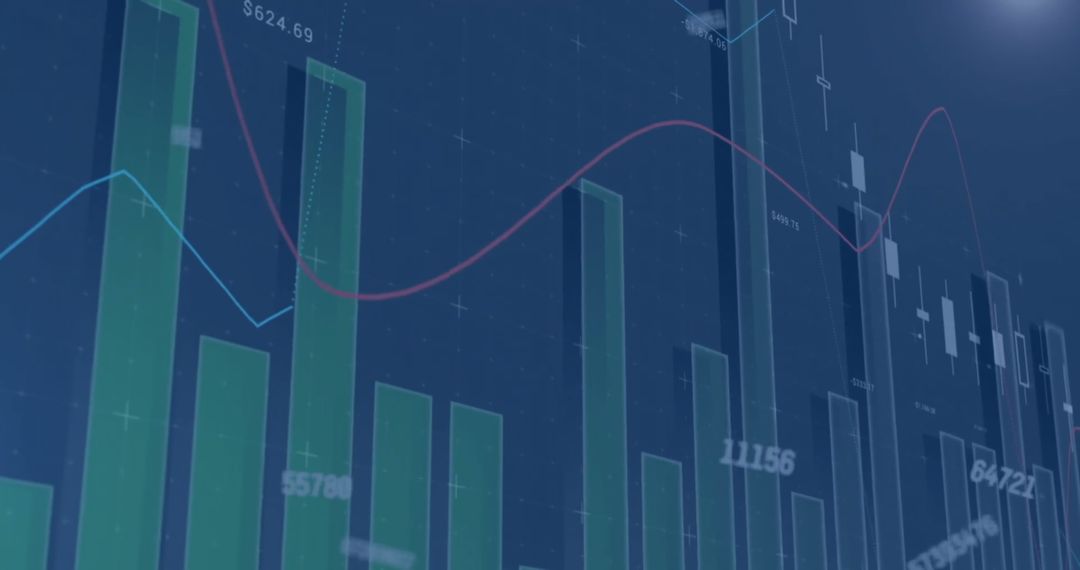
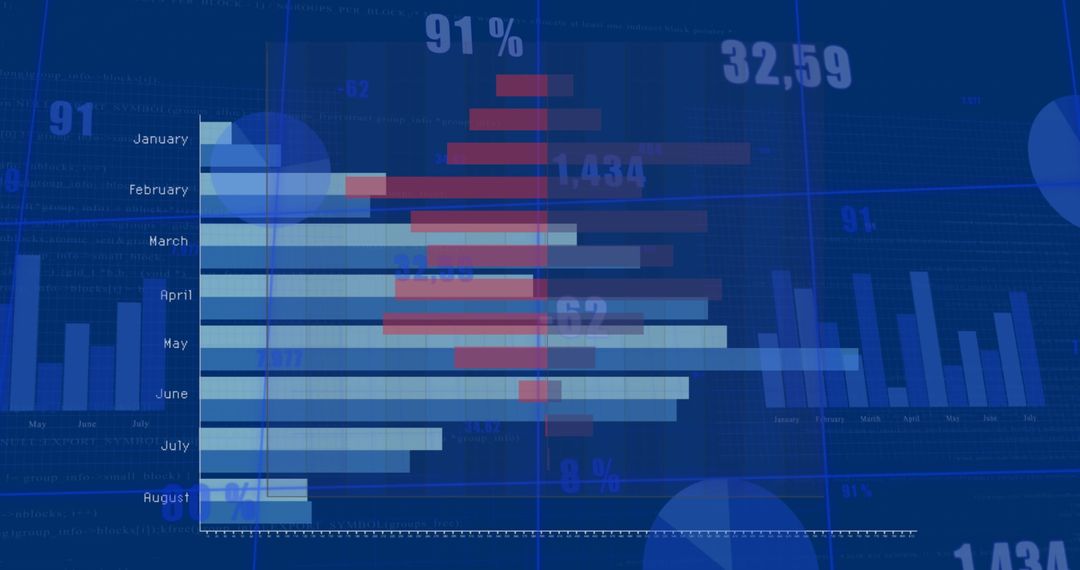
- Colorful Graph with Digital Finance Interface and Data Overlay
Colorful Graph with Digital Finance Interface and Data Overlay Image

Graphic showcasing a colorful bar chart superimposed on a digital network of financial data and statistics. Perfect for use in business reports, finance presentations, and articles focused on data analysis, financial trends, and entrepreneurship. The combination of visual data dynamics depicts a modern approach to global communication and digital transformation.
Powered by 


2
downloads
downloads
Tags:
More
Credit Photo
If you would like to credit the Photo, here are some ways you can do so
Text Link
photo Link
<span class="text-link">
<span>
<a target="_blank" href=https://pikwizard.com/photo/colorful-graph-with-digital-finance-interface-and-data-overlay/a54aacff5148457947770bdff9d218d1/>PikWizard</a>
</span>
</span>
<span class="image-link">
<span
style="margin: 0 0 20px 0; display: inline-block; vertical-align: middle; width: 100%;"
>
<a
target="_blank"
href="https://pikwizard.com/photo/colorful-graph-with-digital-finance-interface-and-data-overlay/a54aacff5148457947770bdff9d218d1/"
style="text-decoration: none; font-size: 10px; margin: 0;"
>
<img src="https://pikwizard.com/pw/medium/a54aacff5148457947770bdff9d218d1.jpg" style="margin: 0; width: 100%;" alt="" />
<p style="font-size: 12px; margin: 0;">PikWizard</p>
</a>
</span>
</span>
Free (free of charge)
Free for personal and commercial use.
Author: People Creations
Similar Free Stock Images

Premium


Premium


Premium


Premium


Premium


Premium


Premium


Premium


Premium


Premium


Premium


Premium


Premium


Premium


Premium


Premium


Premium


Premium


Premium


Premium


Premium


Premium


Premium


Premium