- Home >
- Stock Photos >
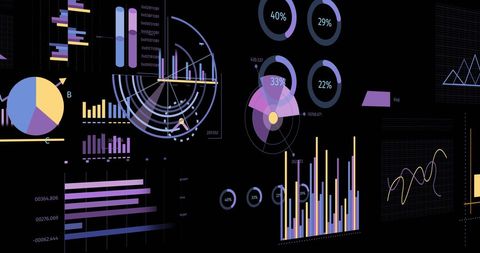
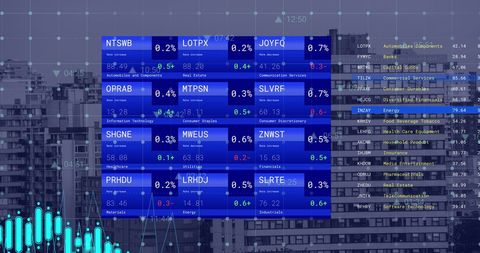
- Colorful Graphs and Analytics Statistics on Digital Interface
Colorful Graphs and Analytics Statistics on Digital Interface Image
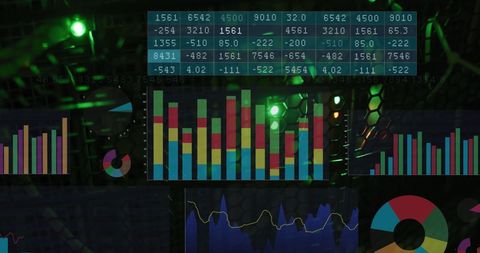
Vibrant visual representation of data analytics through various graphs and charts on a digital interface. High-tech aesthetic suitable for illustrating concepts of modern technology applications, data visualization techniques, and global business intelligence solutions. Perfect for use in tech-focused presentations, articles on data-driven strategies, or educational resources on analytics.

downloads
Tags:
More
Credit Photo
If you would like to credit the Photo, here are some ways you can do so
Text Link
photo Link
<span class="text-link">
<span>
<a target="_blank" href=https://pikwizard.com/photo/colorful-graphs-and-analytics-statistics-on-digital-interface/a8afaf63cc3a00c68b607e23b6897559/>PikWizard</a>
</span>
</span>
<span class="image-link">
<span
style="margin: 0 0 20px 0; display: inline-block; vertical-align: middle; width: 100%;"
>
<a
target="_blank"
href="https://pikwizard.com/photo/colorful-graphs-and-analytics-statistics-on-digital-interface/a8afaf63cc3a00c68b607e23b6897559/"
style="text-decoration: none; font-size: 10px; margin: 0;"
>
<img src="https://pikwizard.com/pw/medium/a8afaf63cc3a00c68b607e23b6897559.jpg" style="margin: 0; width: 100%;" alt="" />
<p style="font-size: 12px; margin: 0;">PikWizard</p>
</a>
</span>
</span>
Free (free of charge)
Free for personal and commercial use.
Author: Creative Art