- Home >
- Stock Photos >
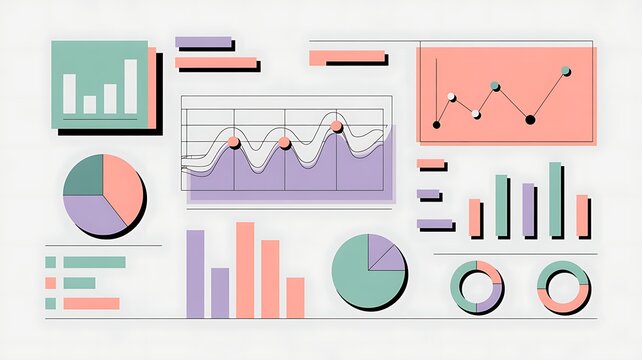
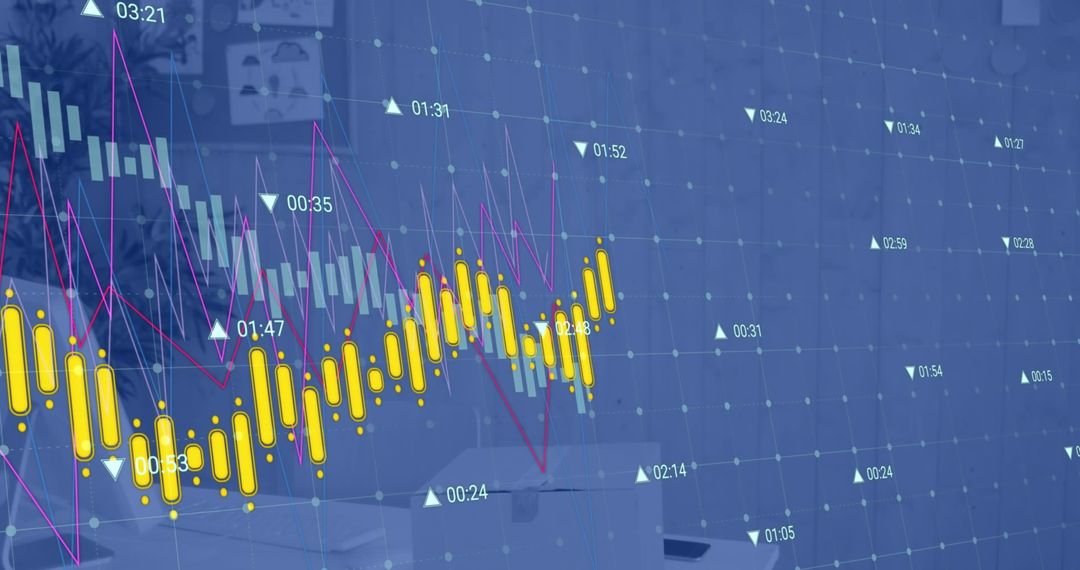
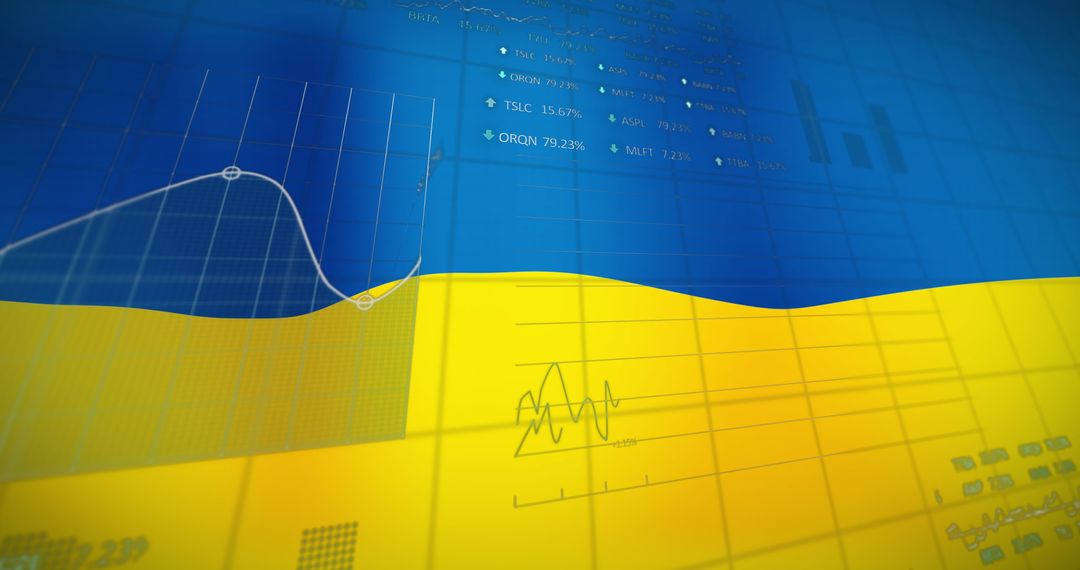
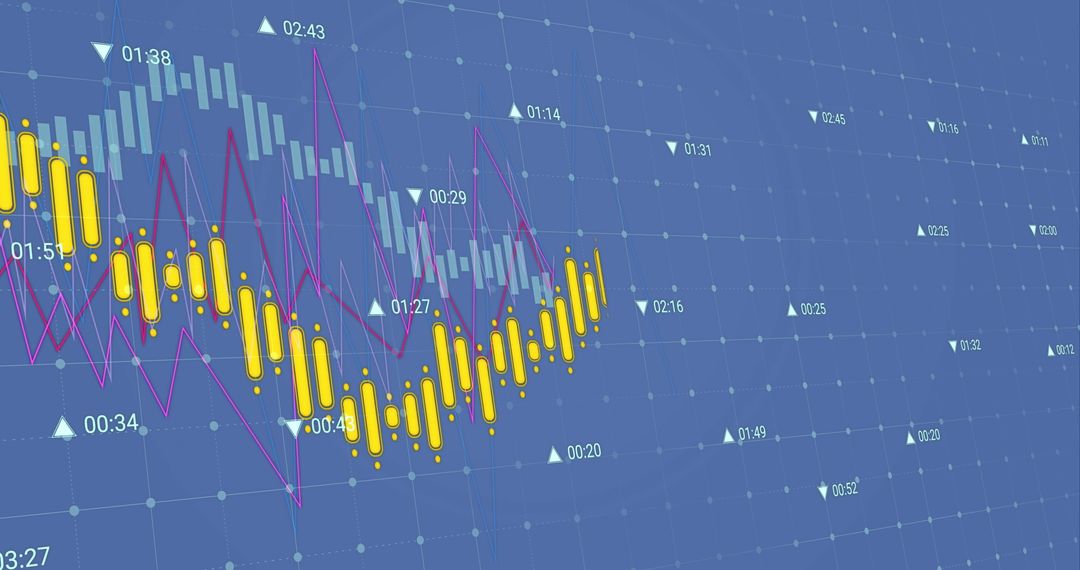
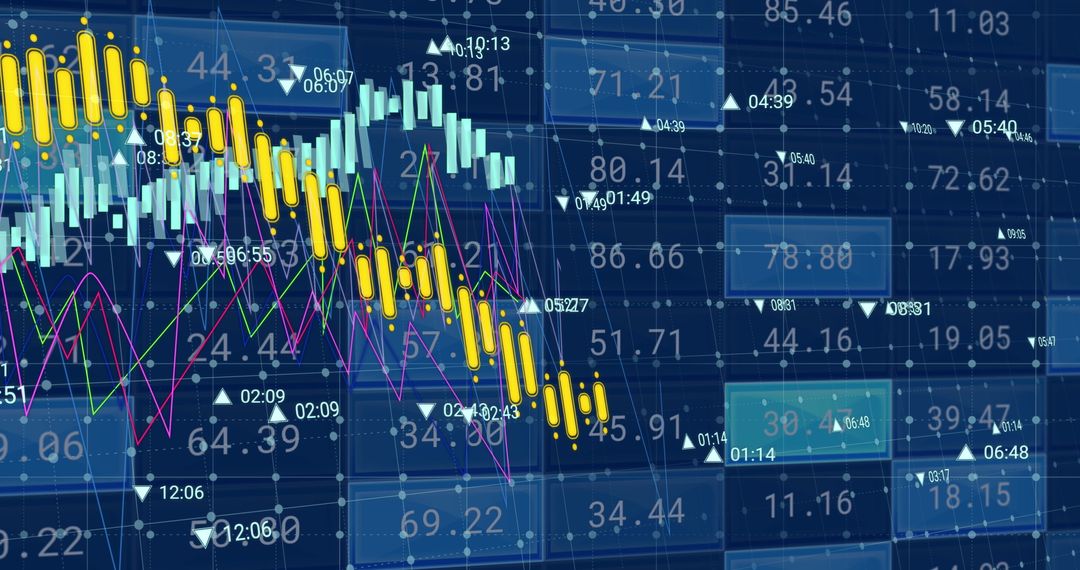
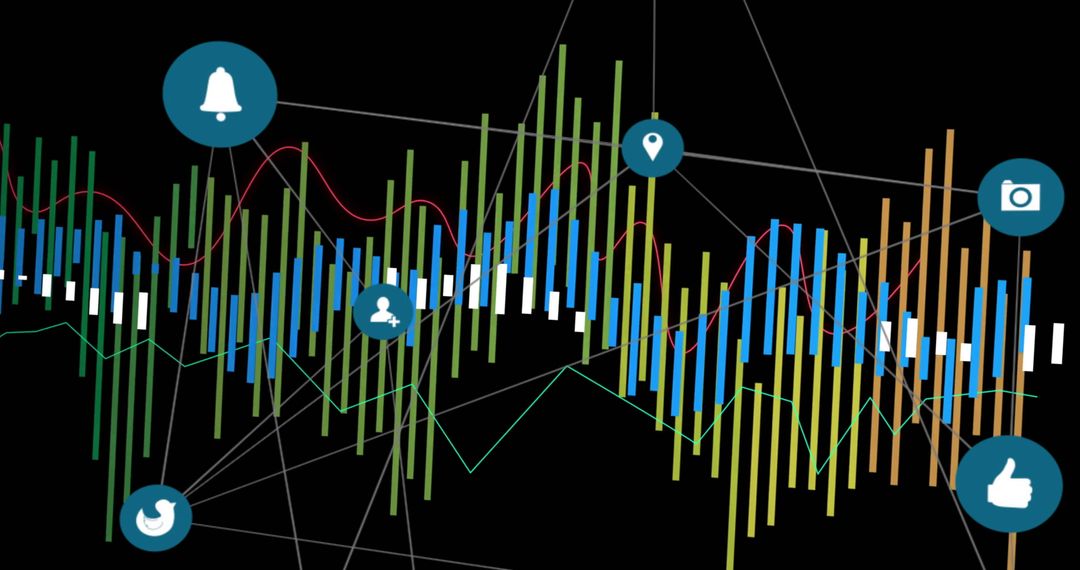
- Colorful Graphs Depicting Data Trends on Digital Screen
Colorful Graphs Depicting Data Trends on Digital Screen Image

Colorful graphs and charts are visualising data trends on a digital interface, featuring various lines and markers that symbolise changes over time. Useful for illustrating concepts in finance, business analytics, research presentations, or educational materials on data tracking techniques.
Powered by 


2
downloads
downloads
Tags:
More
Credit Photo
If you would like to credit the Photo, here are some ways you can do so
Text Link
photo Link
<span class="text-link">
<span>
<a target="_blank" href=https://pikwizard.com/photo/colorful-graphs-depicting-data-trends-on-digital-screen/34d58a26dcf718e93c72a2bdbae51b81/>PikWizard</a>
</span>
</span>
<span class="image-link">
<span
style="margin: 0 0 20px 0; display: inline-block; vertical-align: middle; width: 100%;"
>
<a
target="_blank"
href="https://pikwizard.com/photo/colorful-graphs-depicting-data-trends-on-digital-screen/34d58a26dcf718e93c72a2bdbae51b81/"
style="text-decoration: none; font-size: 10px; margin: 0;"
>
<img src="https://pikwizard.com/pw/medium/34d58a26dcf718e93c72a2bdbae51b81.jpg" style="margin: 0; width: 100%;" alt="" />
<p style="font-size: 12px; margin: 0;">PikWizard</p>
</a>
</span>
</span>
Free (free of charge)
Free for personal and commercial use.
Author: Authentic Images
Similar Free Stock Images
Premium


Premium


Premium


Premium


Premium


Premium


Premium


Premium


Premium


Premium


Premium


Premium


Premium


Premium


Premium


Premium


Premium


Premium


Premium


Premium


Premium


Premium


Premium


Premium