
- Home >
- Stock Photos >
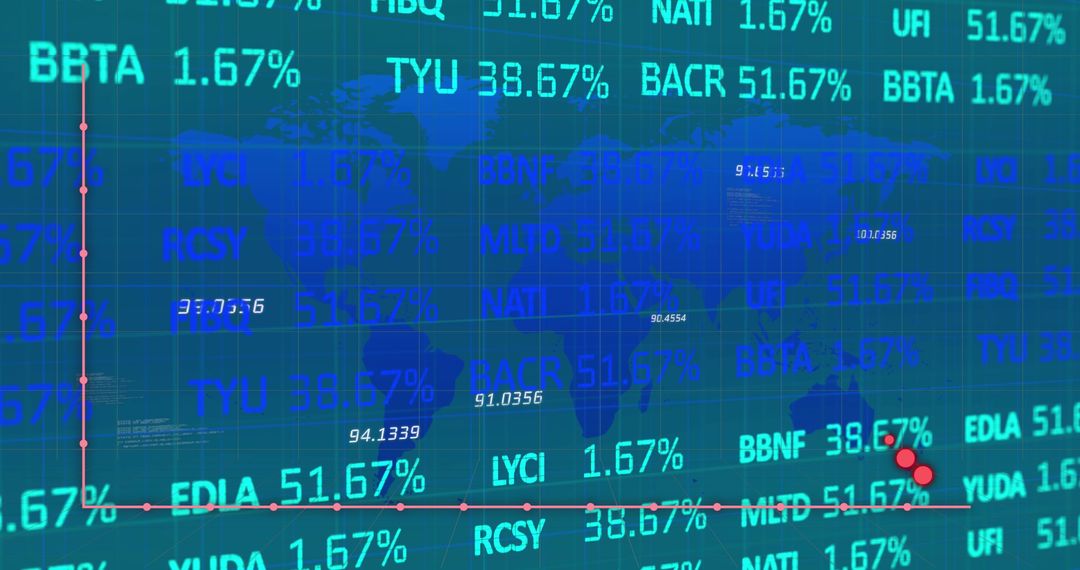
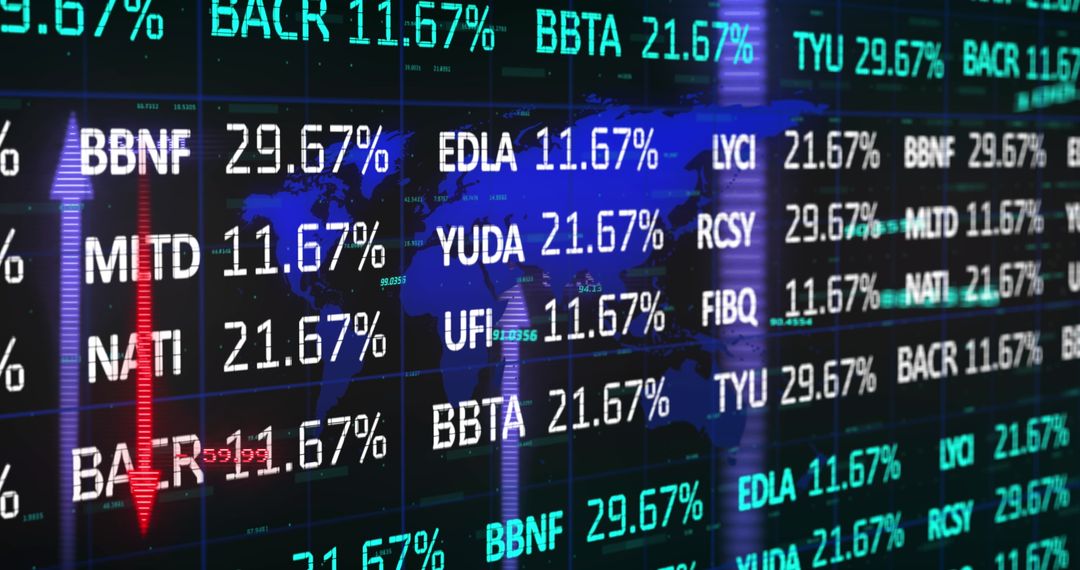
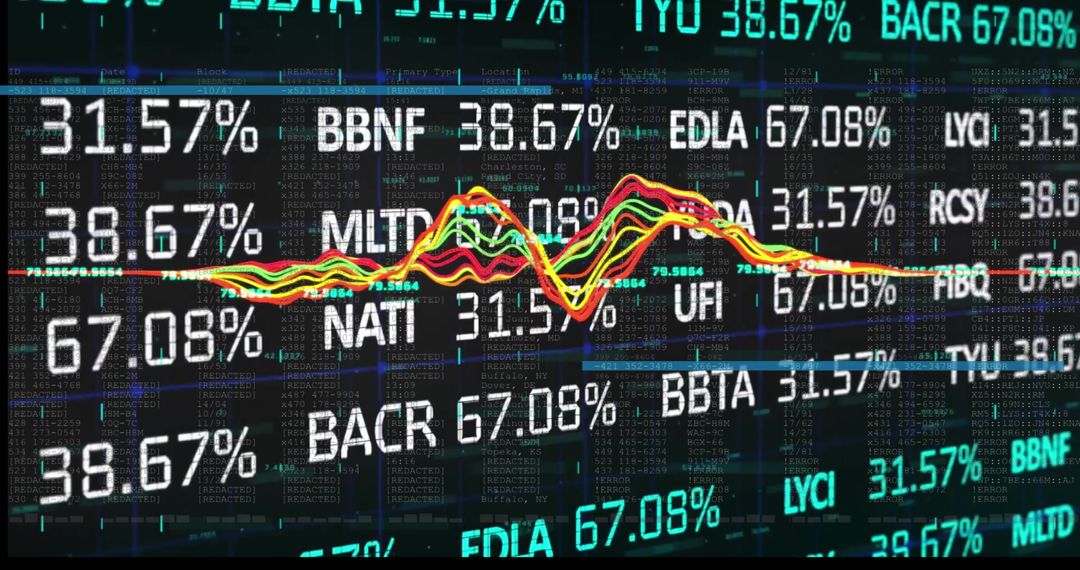
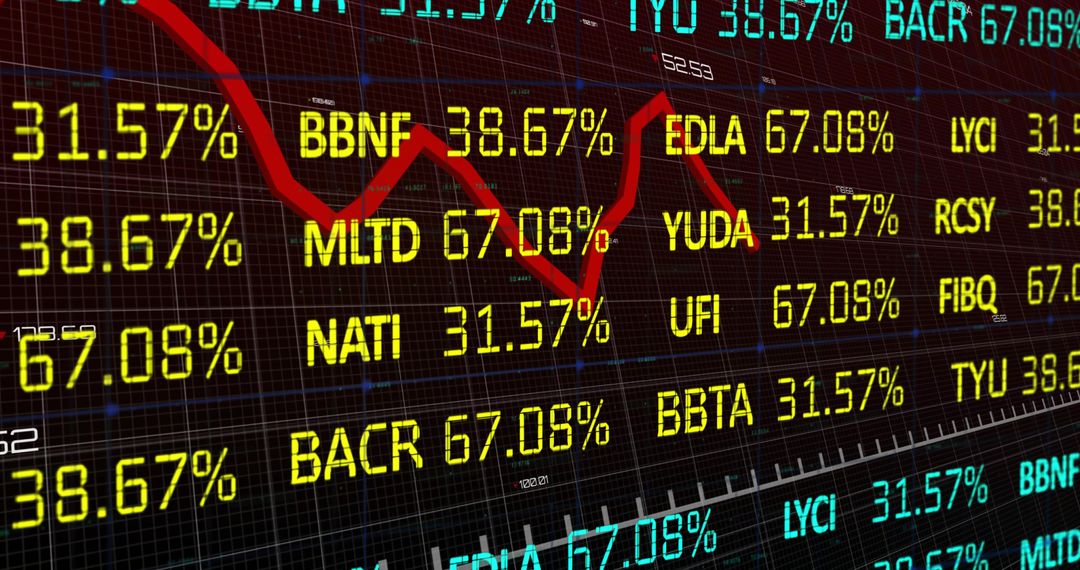
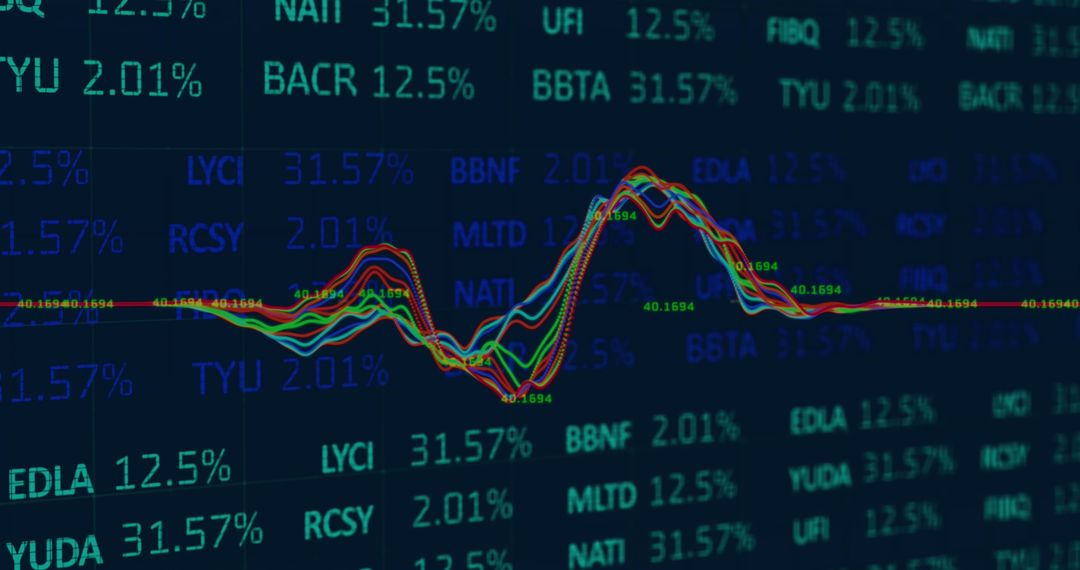
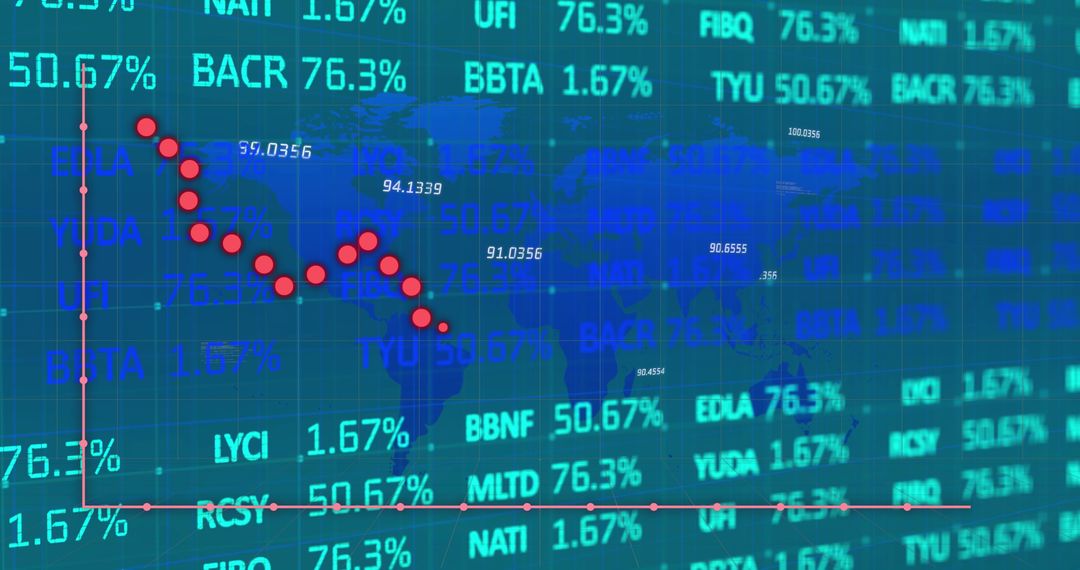
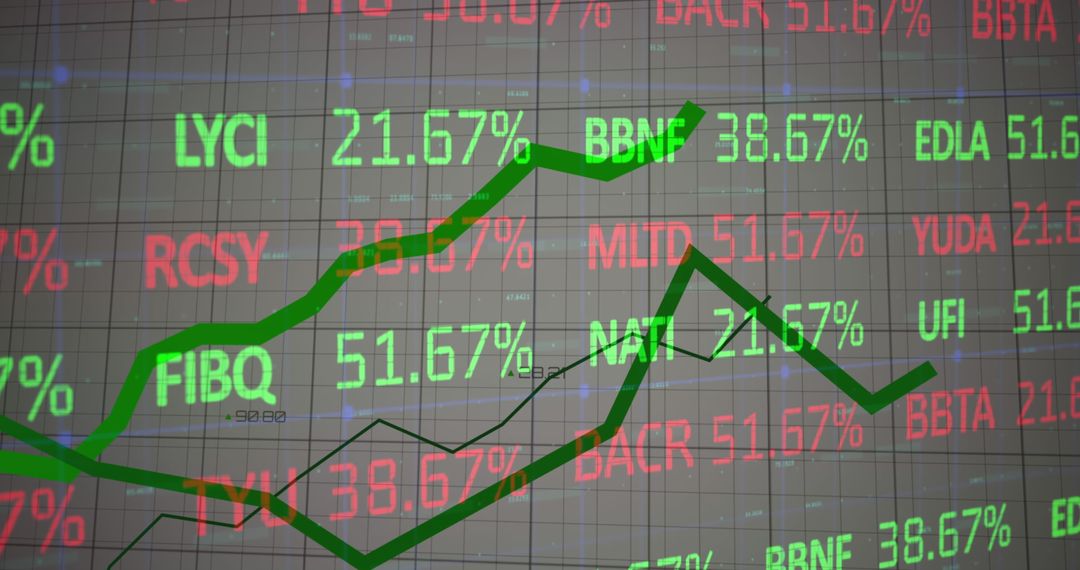
- Colorful Graphs Display on Digital Stock Market Board
Colorful Graphs Display on Digital Stock Market Board Image

Colorful digital graphs overlay a stock trading board, representing fluctuations in stock market values. A dynamic display teeming with numbers, symbolizing quantitative finance and business trends. Perfect for graphics reflecting finance, trading forecasts, and economic analyses. Useful for blogs, finance articles, and presentations focusing on market investment strategies.
Powered by  - Get 15% off with code: PIKWIZARD15


2
downloads
downloads
Tags:
More
Credit Photo
If you would like to credit the Photo, here are some ways you can do so
Text Link
photo Link
<span class="text-link">
<span>
<a target="_blank" href=https://pikwizard.com/photo/colorful-graphs-display-on-digital-stock-market-board/423e112f98d78215a6cd26acf396398f/>PikWizard</a>
</span>
</span>
<span class="image-link">
<span
style="margin: 0 0 20px 0; display: inline-block; vertical-align: middle; width: 100%;"
>
<a
target="_blank"
href="https://pikwizard.com/photo/colorful-graphs-display-on-digital-stock-market-board/423e112f98d78215a6cd26acf396398f/"
style="text-decoration: none; font-size: 10px; margin: 0;"
>
<img src="https://pikwizard.com/pw/medium/423e112f98d78215a6cd26acf396398f.jpg" style="margin: 0; width: 100%;" alt="" />
<p style="font-size: 12px; margin: 0;">PikWizard</p>
</a>
</span>
</span>
Free (free of charge)
Free for personal and commercial use.
Author: Awesome Content
Similar Free Stock Images

Premium


Premium


Premium


Premium


Premium


Premium


Premium


Premium


Premium


Premium


Premium


Premium


Premium


Premium


Premium


Premium


Premium


Premium


Premium


Premium


Premium


Premium


Premium


Premium

